SNMP Explained: A Comprehensive Guide to Network Monitoring
Hey there! If you've ever worked with networks or are just curious about how IT pros keep everything running smoothly, you've probably heard of SNMP. It stands for Simple Network Management Protocol, and despite having "simple" in its name, it can seem pretty complex when you first encounter it.
What's SNMP, Really?
Think of SNMP as the health monitoring system for your network. It's like having tiny reporters (called agents) stationed at every important device on your network—your routers, switches, servers, and even printers. These agents keep an eye on what's happening and report back to a central manager.
We remember when we first started working with networks, we were amazed at how SNMP could tell us exactly what was going wrong with a router or a point-to-point wireless radio across town without leaving our desk. It's pretty magical when you think about it!
SNMP works as part of the TCP/IP protocol suite (the language of the internet), and it helps us monitor performance, spot issues before they become disasters, and plan for future growth.
How SNMP Works (Without the Jargon)
Let me break this down in a way that actually makes sense:
Imagine you're the manager of a large apartment building. You can't personally check every apartment daily, so you have staff members (these are your SNMP agents) stationed throughout the building.
When you need information, you send a message asking, "How's everything going?" (that's an SNMP Get command). Your staff checks their specific areas and reports back with the details (the response).
Sometimes, if there's an emergency like a water leak, your staff doesn't wait for you to ask—they immediately alert you (that's an SNMP Trap).
All the information about what should be monitored in each apartment is kept in a guidebook (that's your Management Information Base or MIB).
Makes more sense now, right?
The Three Main Players in SNMP
The SNMP Manager: This is you—or rather, the software you use like EyeOTmonitor to keep an eye on everything. It sends requests and receives responses and alerts.
SNMP Agents: These are the little software programs running on all your network devices, collecting data about how they're performing.
The MIB (Management Information Base): Think of this as a really well-organized filing cabinet. Every piece of information has its specific place with a unique address (called an OID or Object Identifier).
We've spent countless hours configuring these components, and while it can be tedious, there's something satisfying about seeing your entire network laid out before you, all reporting in perfectly.
The Evolution of SNMP: From Basic to Secure
SNMP has been around for quite a while, and it's gone through several iterations:
SNMPv1: The original version. It's like that old flip phone you used to have—basic but reliable. However, it doesn't offer much in terms of security.
SNMPv2c: This added some improvements, like better error handling, but still didn't fix the security issues. It's like upgrading to a slightly better flip phone.
SNMPv3: Now we're talking! This version finally addressed security concerns by adding authentication, encryption, and user access controls. It's like jumping from that flip phone straight to a modern smartphone with face recognition.
We've worked with all three versions, and let us tell you, setting up SNMPv3 might take a bit more time, but the peace of mind is worth it, especially in today's security-conscious world.
Why SNMP Monitoring Matters (From Someone Who's Been There)
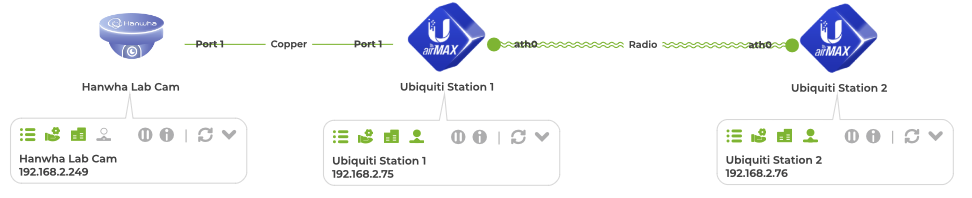
Here’s a quick story from the field. We had a customer with a camera that kept dropping offline at random times. At first, we figured it had to be the camera—maybe a bad cable, a firmware issue, or a power problem. We swapped the cable, rebooted the camera, even checked the switch port—everything looked fine. But the issue kept happening.
Since the camera was running over a point-to-point (P2P / PtP) wireless link, we took a closer look at the radio connection. That’s when we noticed something interesting—every time the camera cut out, the RSSI dropped, and the noise floor spiked. Turns out, the problem wasn’t the camera at all. The wireless link was getting hit with interference, causing the connection to degrade just enough to drop the feed.
Once we adjusted the radio’s frequency to steer clear of the interference, the camera stayed solid. It was a good reminder that not every device issue is actually a device issue—sometimes, it’s what’s happening upstream.
SNMP monitoring gives you:
- Early warning of problems (before your users start complaining)
- Insights into performance bottlenecks
- Data for capacity planning
- The ability to spot trends over time
Traps vs. Polling: Two Ways to Stay Informed
SNMP gives you two methods to gather information:
SNMP Traps: These are like emergency alerts. Your device notices something important (like a fan failure or a port going down) and immediately sends an alert to your management system. You're not constantly checking, but you'll know when something important happens.
SNMP Polling: This is like regularly scheduled check-ins. Your management system asks each device, "How are you doing?" at set intervals. It's methodical and thorough but generates more network traffic.
In our experience, the best approach is to use both: set up polling for regular health checks and traps for immediate notification of critical events.
Setting Up SNMP: Not as Scary as It Seems
Configuring SNMP might seem daunting at first, but it follows a logical process:
Decide which devices you need to monitor
Choose the right SNMP version for your security needs
Configure your devices to allow SNMP access
Set up your management software to poll these devices
The trickiest part is usually getting the security settings right. If you're using SNMPv1 or v2c, you'll need to set up community strings (think of these as passwords). For SNMPv3, you'll configure usernames, authentication protocols, and encryption.
A word of advice: never use the default community strings like "public" or "private." That's like leaving your front door key under the welcome mat!
The Complexity of SNMP in Real Networks
When implementing SNMP monitoring across different device types and vendors, there are some important nuances to understand.
For one thing, identifying the right properties to monitor isn't always straightforward. As Kirill Sokolinsky, our COO/CPO explains in the video above: "If I am trying to monitor my network and monitor specific properties of a device, it's not that easy. You have to go and identify different models of devices."
For example, if you have different models of Cisco switches—say, a 3750 and a Nexus switch—they'll have completely different MIB structures with different properties for different OIDs and different ways of getting and modeling that data.
This means if you want specific information about fan status, temperature, memory utilization, or POE information, you'll need to find the correct MIBs and the correct OIDs. These could be hidden in tables and sub-tables, and building out that model could take days.
Another challenge is interpreting the data properly. As Kirill notes: "Imagine you're getting a fan status, right? And it comes in as a boolean condition, a one or a two. Well, it doesn't tell you anything. One could be good, two could be bad or vice versa."
Extraction Scripts: Making Sense of the Data
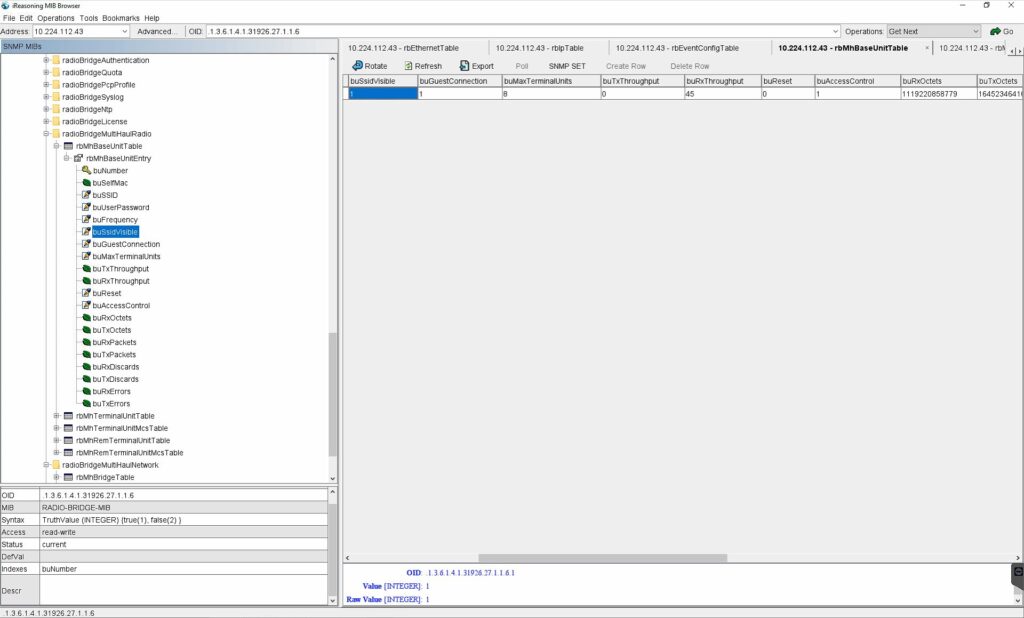
This is where extraction scripts become essential. Raw SNMP data often comes back in formats that aren't immediately useful or human-readable. For instance, the below image is from iReasoning's MIB Browser that shows Siklu's MultHaul Base Unit information. buSsidVisible OID is showing a boolean value of '1' which means that the SSID is visible on the network. A network engineer would need to understand that 1 represents 'true' and 2 represents 'false' as stated under the Syntax section of the MIB Browser.
Extraction scripts transform this raw data into meaningful information. As Kirill mentions in the video: "What we do is we create extraction scripts that allow you to have a recognizable way to identify issues."
These scripts can:
- Convert numeric codes into human-readable statuses (e.g., "1" becomes "Operational")
- Transform raw signal values into standardized metrics (e.g., RSSI values that make sense)
- Normalize data from different vendor formats into consistent measurements
- Extract specific values from complex tables or nested data structures
- Apply contextual interpretation based on device type and model
Creating these extraction scripts requires deep knowledge of each vendor's MIB structure and data representation, but once implemented, they make monitoring significantly more intuitive and actionable.
When done properly, a good extraction system provides data that's "readable to you in such a way where it's easy to understand, right? So instead of just a bunch of numbers, we give you RSSI values, for example, that actually make sense to you.
Challenges You Might Face (And How to Overcome Them)
Let's be honest: SNMP isn't perfect. Here are some challenges we've encountered and how to address them:
Security concerns: Especially with older versions. Solution: Use SNMPv3 whenever possible, and if you must use v1 or v2c, restrict access using firewall rules.
Configuration complexity: Getting everything set up correctly can be tricky. Solution: Start small with a few devices, test thoroughly, then expand.
Performance impact: Heavy polling can affect device performance. Solution: Adjust your polling intervals—not everything needs to be checked every minute.
Data overload: It's easy to collect too much data and get overwhelmed. Solution: Focus on critical metrics first, then add more as needed.
The Future of SNMP: Still Relevant in a Changing World
You might wonder if SNMP is still relevant with newer technologies emerging. The short answer is: absolutely!
While there are newer protocols like NETCONF with Yang modeling that are gaining some ground in network world, SNMP remains the universal language of network monitoring. It's supported by virtually every network device manufacturer and works across different platforms.
That said, SNMP is evolving to handle the challenges of modern networks:
- Integration with big data analytics for more insightful monitoring
- Adaptation to cloud and virtualized environments
- Enhanced security features to protect against newer threats
We're particularly excited about how SNMP is being integrated with automation tools, allowing networks to not just report problems but potentially fix them automatically.
Cross-Vendor Monitoring Considerations
When monitoring multi-vendor networks, keep these points in mind:
- MIB Availability: Different vendors provide varying levels of MIB documentation and support. Cisco typically offers comprehensive documentation, while smaller vendors may have more limited resources.
- OID Discovery: Tools like MIB Browser are essential for navigating complex OID structures, especially when working with private MIBs.
- Data Interpretation: Similar metrics may be represented differently across vendors. For example, signal strength might be expressed in different units or scales.
- Public vs. Private MIBs: Standard metrics are available through public MIBs (like RFC 1213-MIB), while vendor-specific features require private MIBs.
- Integration Challenges: Modern monitoring platforms need to normalize data from different vendors to present unified dashboards and alerts.
This vendor-specific approach to SNMP monitoring enables network administrators to take full advantage of the unique capabilities of each manufacturer's equipment while maintaining a comprehensive monitoring strategy across the entire network infrastructure.
How EyeOTmonitor Leverages SNMP for Comprehensive Network Visibility
While SNMP is powerful on its own, implementing it effectively across diverse network equipment requires expertise and purpose-built tools. Here's how EyeOTmonitor leverages SNMP to provide enhanced network visibility:
Pre-Built Device Models
One of the most time-consuming aspects of SNMP monitoring is creating accurate device models. As our team explains: "What EyeOTmonitor does is we, as a team, create those models for you. We do it for the customers."
This means:
- You don't need to spend days researching specific MIBs for each device type
- Device properties are already mapped to the correct OIDs
- New device support is continuously added to the platform
Intelligent Data Interpretation
Raw SNMP data is often meaningless without context. EyeOTmonitor handles this interpretation automatically:
"We create extraction scripts that allow you to have a recognizable way to identify issues. And then we provide that to you on a silver platter basically in EyeOTmonitor where whenever you bring that device in, you get predefined models."
For example, instead of seeing cryptic numeric values, you'll see properly labeled metrics like:
- Signal strength in appropriate units
- Temperature with proper thresholds
- Fan status as "operational" or "failed" rather than "1" or "2"
Built-in Historical Tracking
EyeOTmonitor automatically stores historical data for important properties, allowing you to:
- Track performance over time
- Identify trends and patterns
- Compare current performance to baseline
- Detect gradual degradation before it becomes critical
"We then tie in historical data for those properties. And on top of that, we already specify severity levels for those properties, right? So what constitutes normal CPU usage versus warning versus severe versus critical."
Smart Event and Alert Management
Not every change in device status deserves an immediate alert. EyeOTmonitor provides sophisticated alert management:
"We can alert on those different components or create events on those components. Whatever this would be so you know, we are the ones sitting there with tools like MIB browser and other tools and extract data from devices."
The system allows you to:
- Configure different thresholds for different device types
- Set alert delays based on device criticality
- Generate events for trend analysis without sending notifications
- Customize notification methods and recipients
Cross-Vendor Normalization
With EyeOTmonitor, you get consistent monitoring regardless of manufacturer:
"You get predefined models, historical data on properties, severity rules for the properties that need to have severity rules on... predefined already that you can then modify and data that's readable to you in such a way where it's easy to understand."
This normalization works across:
- Ubiquiti wireless equipment (all five radio types)
- Mikrotik routers and switches
- IP cameras from various manufacturers
- Cambium networking gear
- Cisco enterprise equipment
- And many other vendors
From Technical Data to Business Intelligence
Perhaps most importantly, EyeOTmonitor transforms low-level SNMP data into actionable business intelligence:
"Down the road, if you can get enough devices across multiple customers in different locations, and then you could start tracking issues with devices, you could potentially start thinking about trends."
This approach elevates SNMP from a technical troubleshooting tool to a strategic asset for network planning and management. By handling the complexity behind the scenes, EyeOTmonitor makes advanced network monitoring accessible to organizations of all sizes.
Final Thoughts
SNMP may not be the flashiest technology, but it's one of those workhorses that keeps our networks running smoothly behind the scenes. We've seen firsthand how proper SNMP monitoring has saved companies from disastrous outages and helped identify performance issues before users even notice.
Whether you're just starting your journey into network management or you're a seasoned pro looking to refine your monitoring strategy, we hope this guide has made SNMP a bit more approachable.
Remember, good network monitoring is like having insurance—you hope you never need it, but you'll be incredibly grateful it's there when problems arise!
Quick Reference: SNMP Terms to Know
- SNMP: Simple Network Management Protocol—your network's health monitoring system
- SNMP Agent: The software on network devices that collects and reports data
- SNMP Manager: The central application that monitors all your agents
- MIB: Management Information Base—the structured database of all monitorable objects
- OID: Object Identifier—the unique address for each item in the MIB
- SNMP Trap: An unsolicited alert from an agent about an important event
- Community String: A password-like authentication method used in SNMPv1 and v2c