EyeOTmonitor for WISPs:
Your Single Source of Network Truth

With EyeOTmonitor gain real-time insights, reduce downtime, and deliver exceptional service to your customers — all while scaling your operations with ease.
Free Trial Book a Demo
A Single Pane of Glass: The Centralized Source of Truth for WISP Operations

WISPs often face challenges with fragmented, free, and outdated tools where data must be manually added, maintained, and monitored. These inefficiencies lead to wasted time, inconsistent information, and missed opportunities to optimize network performance. EyeOTmonitor eliminates these challenges by providing a single source of truth through its three core components: Topology Maps, Geospatial Maps, and Dashboards. This unified approach ensures that all your network data is accessible, up-to-date, and actionable in one place.

Replace fragmented tools with a platform that combines network health metrics, device management, topological, and geospatial views all into a single platform.
Supports major WISP switching/routing, fixed wireless, and fiber vendors, including Ubiquiti, Cambium, Mimosa and MikroTik.
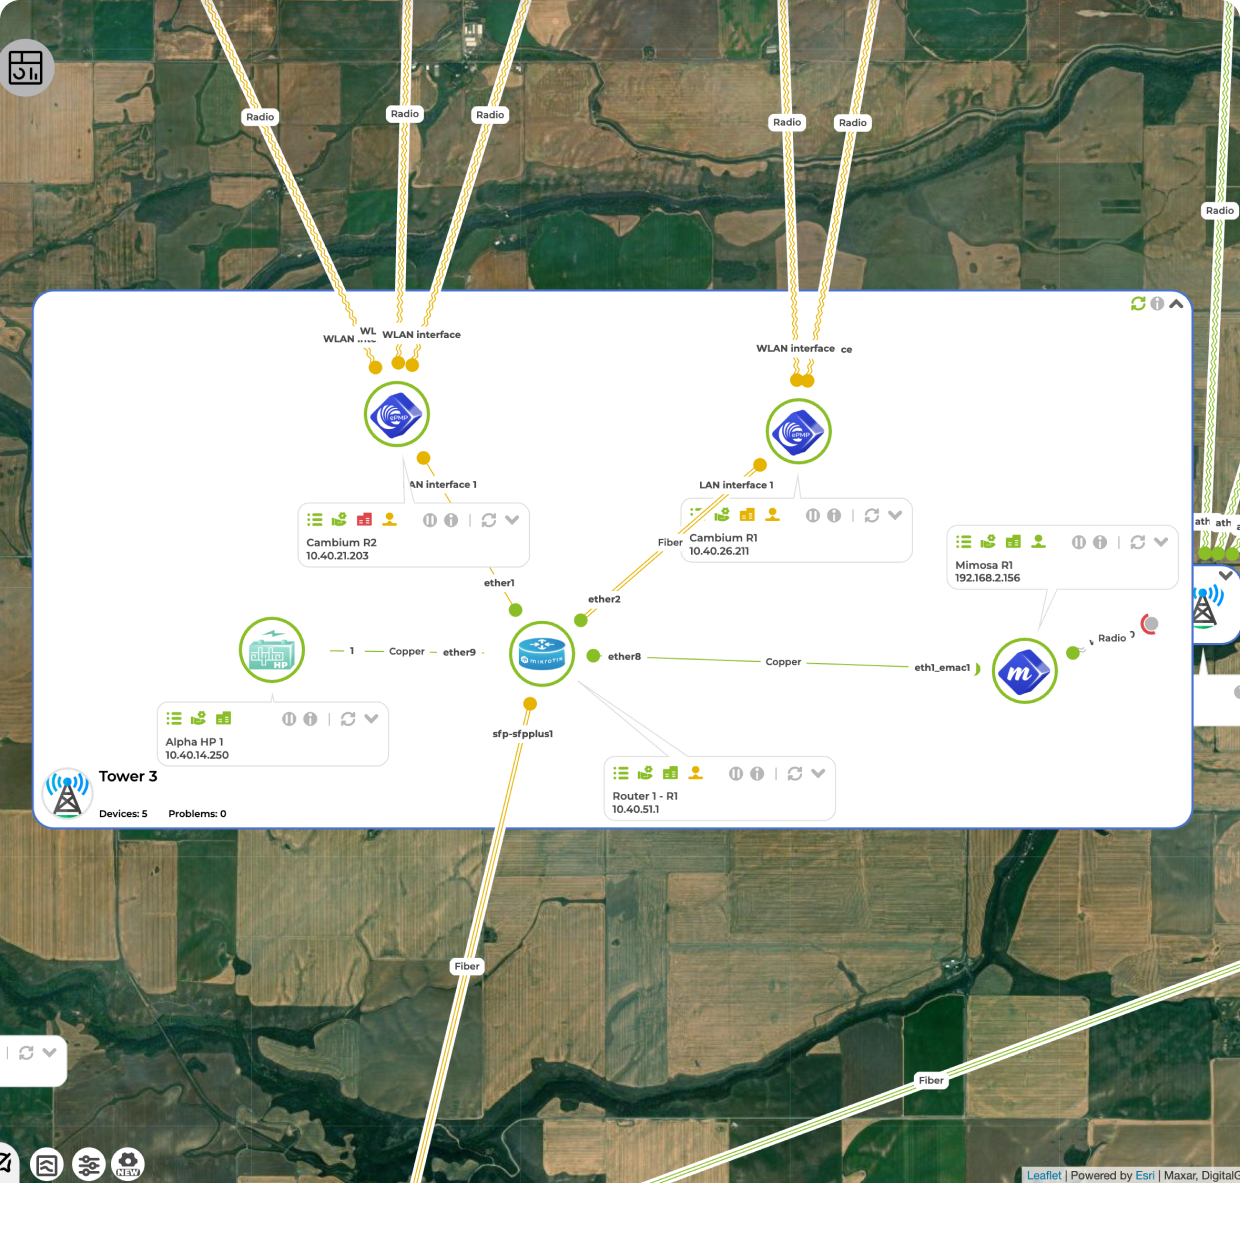
Real-time topology and geospatial maps with automatic device placement and link status updates.
Quickly identify and resolve issues with real-time alerts and dynamic map color coding.
Quickly identify and address critical problems by categorizing and prioritizing device issues based on severity levels
Proactively detect and resolve underperforming devices, unstable links, and power issues before they escalate into service outages.
Dynamic Geospatial and Topology Maps: Visualize Your Network Like Never Before
Dynamic Interface/Link Monitoring
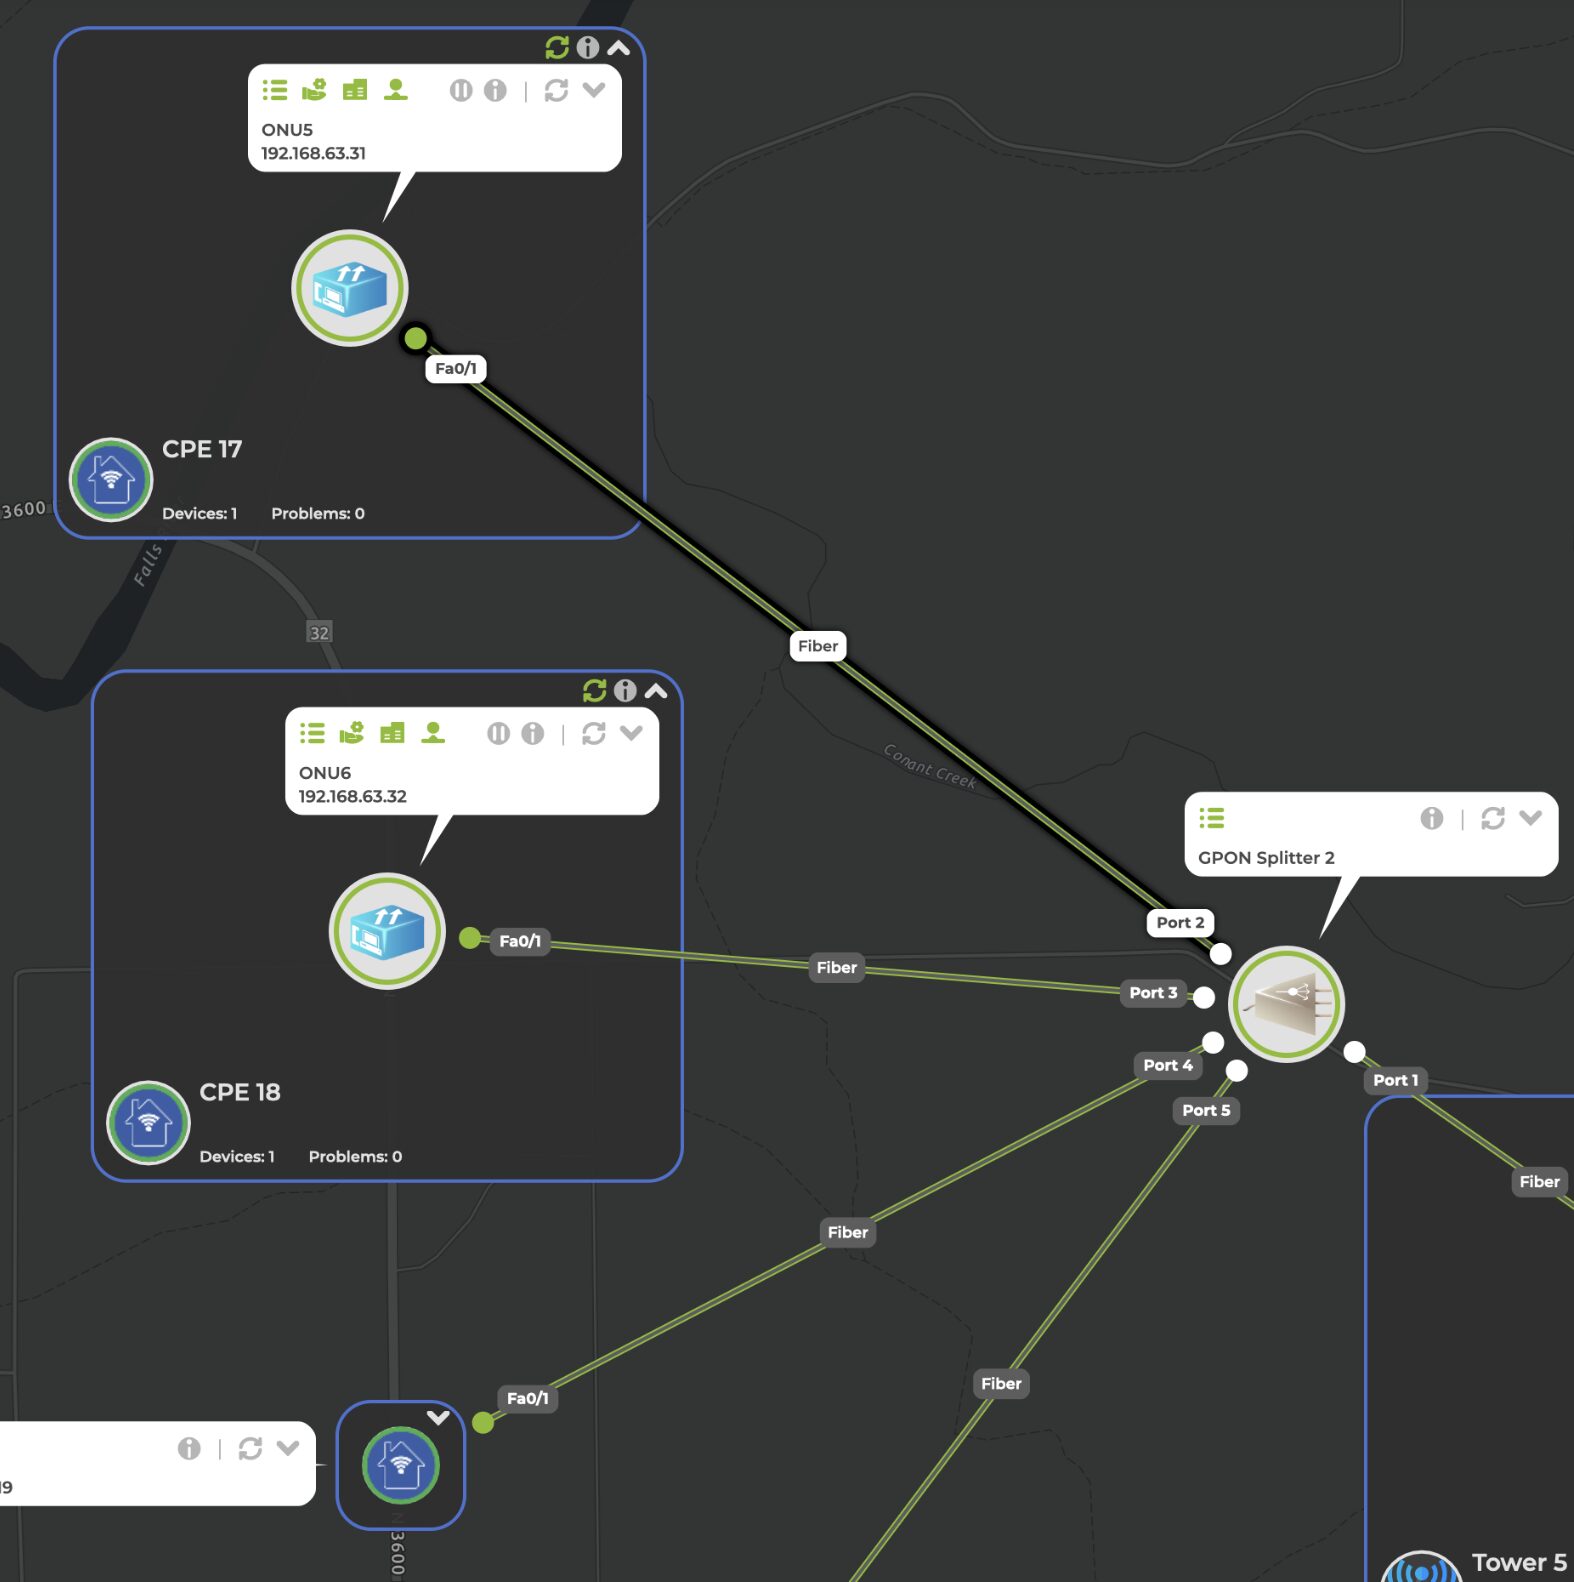
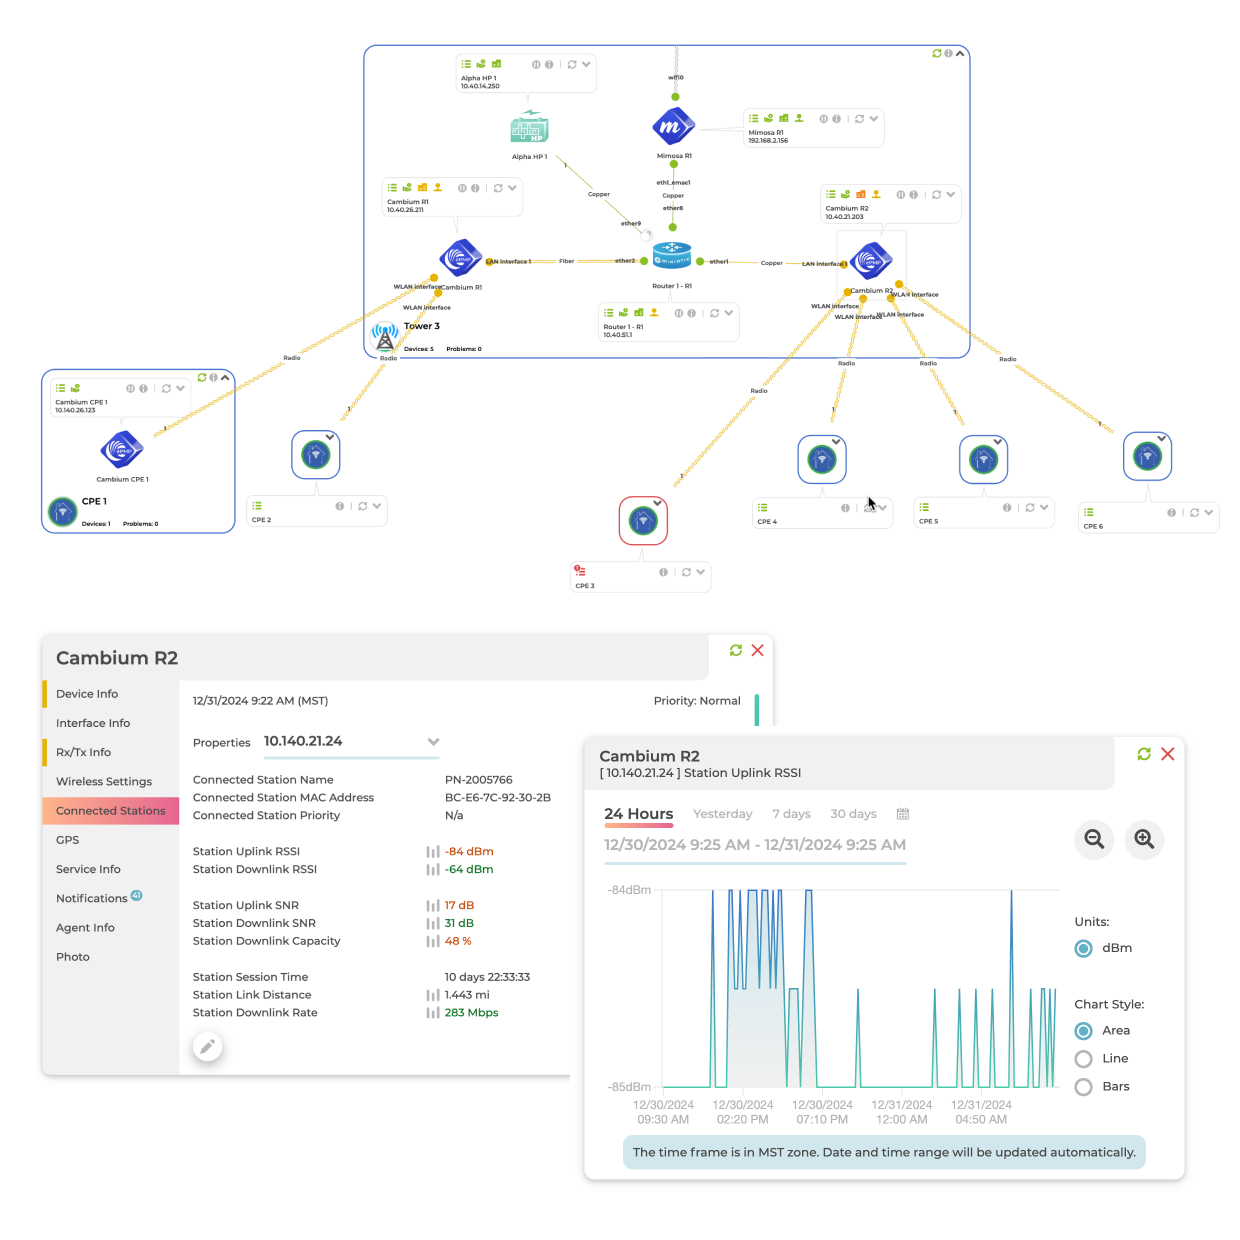
Interfaces and links change color based on severity (e.g., RX/TX traffic, RSSI, SNR).
Device Grouping
Consolidate assets like tower equipment, customer-premises equipment (CPE), and Points of Presence (POP) sites into single icons for a clean and organized visual representation.
Vertical Link Profiles
Display link details vertically to highlight issues such as Fresnel zones, elevation mismatches, and link distances.
Multiple Map Options
Provide multiple map styles, including dark, light, and satellite views, to suit different visualization needs.

Seamless Integration with
Industry-Leading Vendors

EyeOTmonitor provides comprehensive support for a wide range
of devices across wireless, fiber, and networking ecosystems.

See What Metrics We Monitor
 Fixed Wireless Radios, WiFi APs, Fiber, Routers, Switches
Fixed Wireless Radios, WiFi APs, Fiber, Routers, Switches
 Fixed Wireless Radios
Fixed Wireless Radios
 Fixed Wireless Radios, WiFi APs
Fixed Wireless Radios, WiFi APs
 Fixed Wireless Radios, Routers, Switches
Fixed Wireless Radios, Routers, Switches
 Fixed Wireless Radios
Fixed Wireless Radios
 Fixed Wireless Radios
Fixed Wireless Radios
 Fixed Wireless Radios
Fixed Wireless Radios
 Fixed Wireless Radios
Fixed Wireless Radios
 Fixed Wireless Radios
Fixed Wireless Radios
 Fixed Wireless Radios
Fixed Wireless Radios
WiFi Access Points
WiFi Access Points
 Fiber Networks
Fiber Networks
 Fiber Networks
Fiber Networks
 Fiber Networks
Fiber Networks
 Fiber Networks
Fiber Networks
 Fiber Networks
Fiber Networks
Fiber Networks
Fiber Networks
Routers, Switches
 Routers, Switches
Routers, Switches
 Routers, Switches
Routers, Switches
 Routers, Switches
Routers, Switches
 Universal Power Supplies
Universal Power Supplies
 Universal Power Supplies
Universal Power Supplies
Automated Alerts: Stay Ahead with Instant Updates
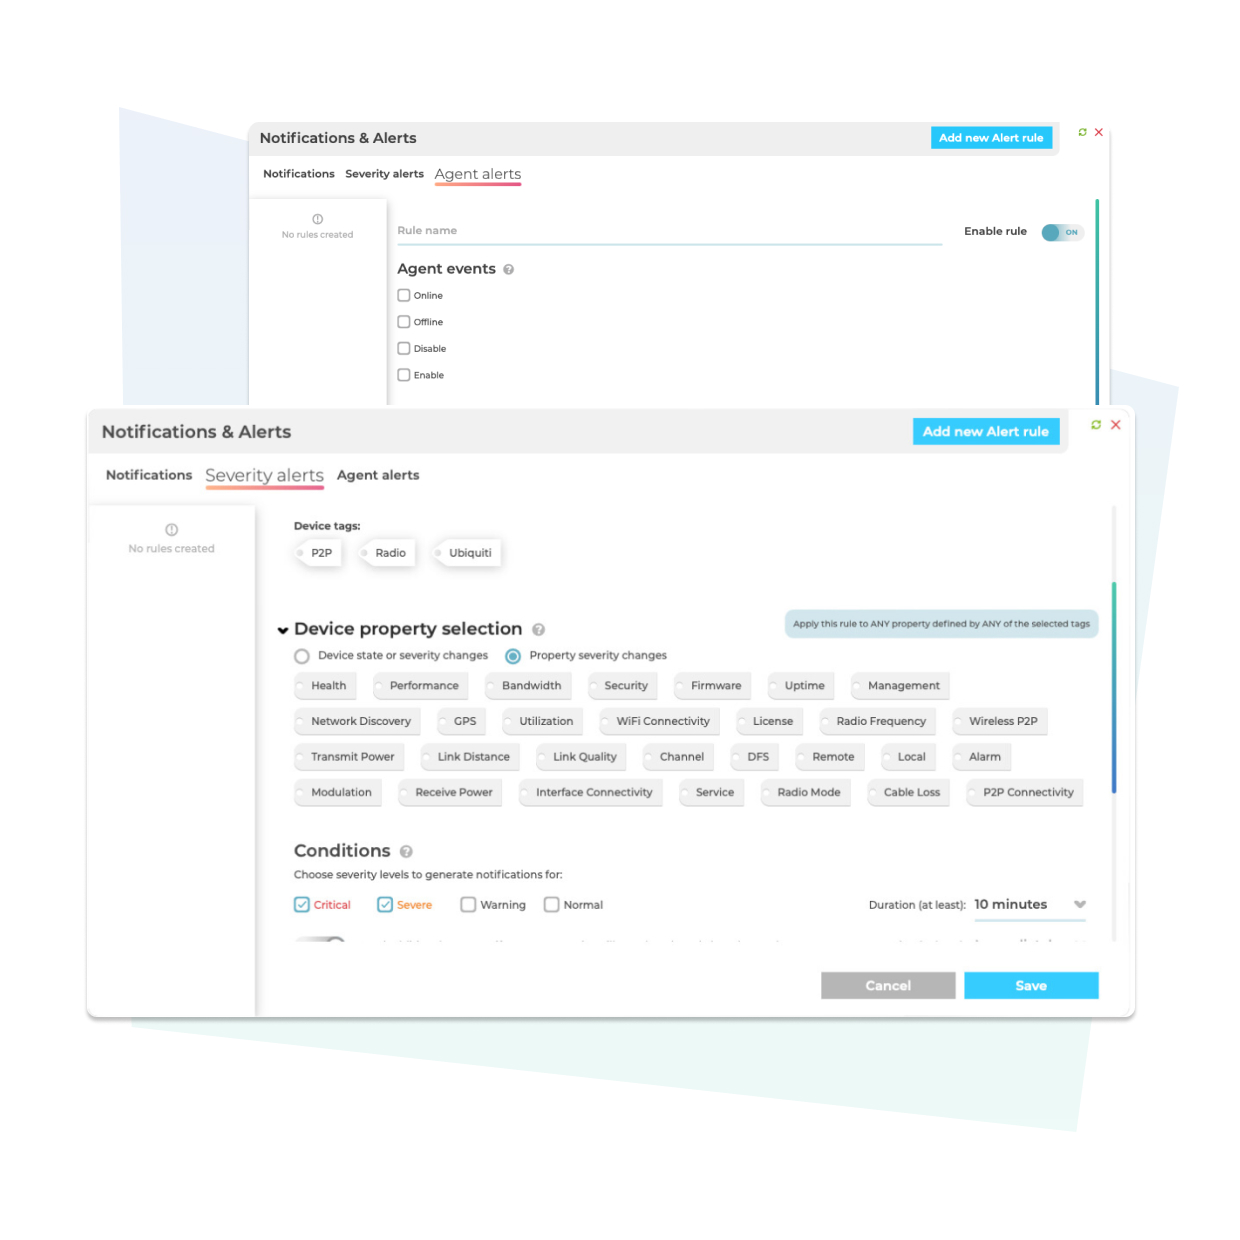
  • Smart Alerts: Triggered by severity level changes, such as RSSI dropping below a threshold or network traffic exceeding set limits.
  • Flexible Notifications: Delivered via email or in-system alerts to ensure prompt awareness of potential issues.
  • Customizable Priorities: Configure device-specific priorities, assigning high-priority alerts to critical infrastructure like backhaul radios and APs, while setting low-priority alerts for CPE devices.
  • Focused Response: Ensures critical issues are addressed first, streamlining network management and reducing downtime.
Alerts-wisps-3
Insightful Notifications and Trends: Track History, Spot Patterns, Stay Ahead
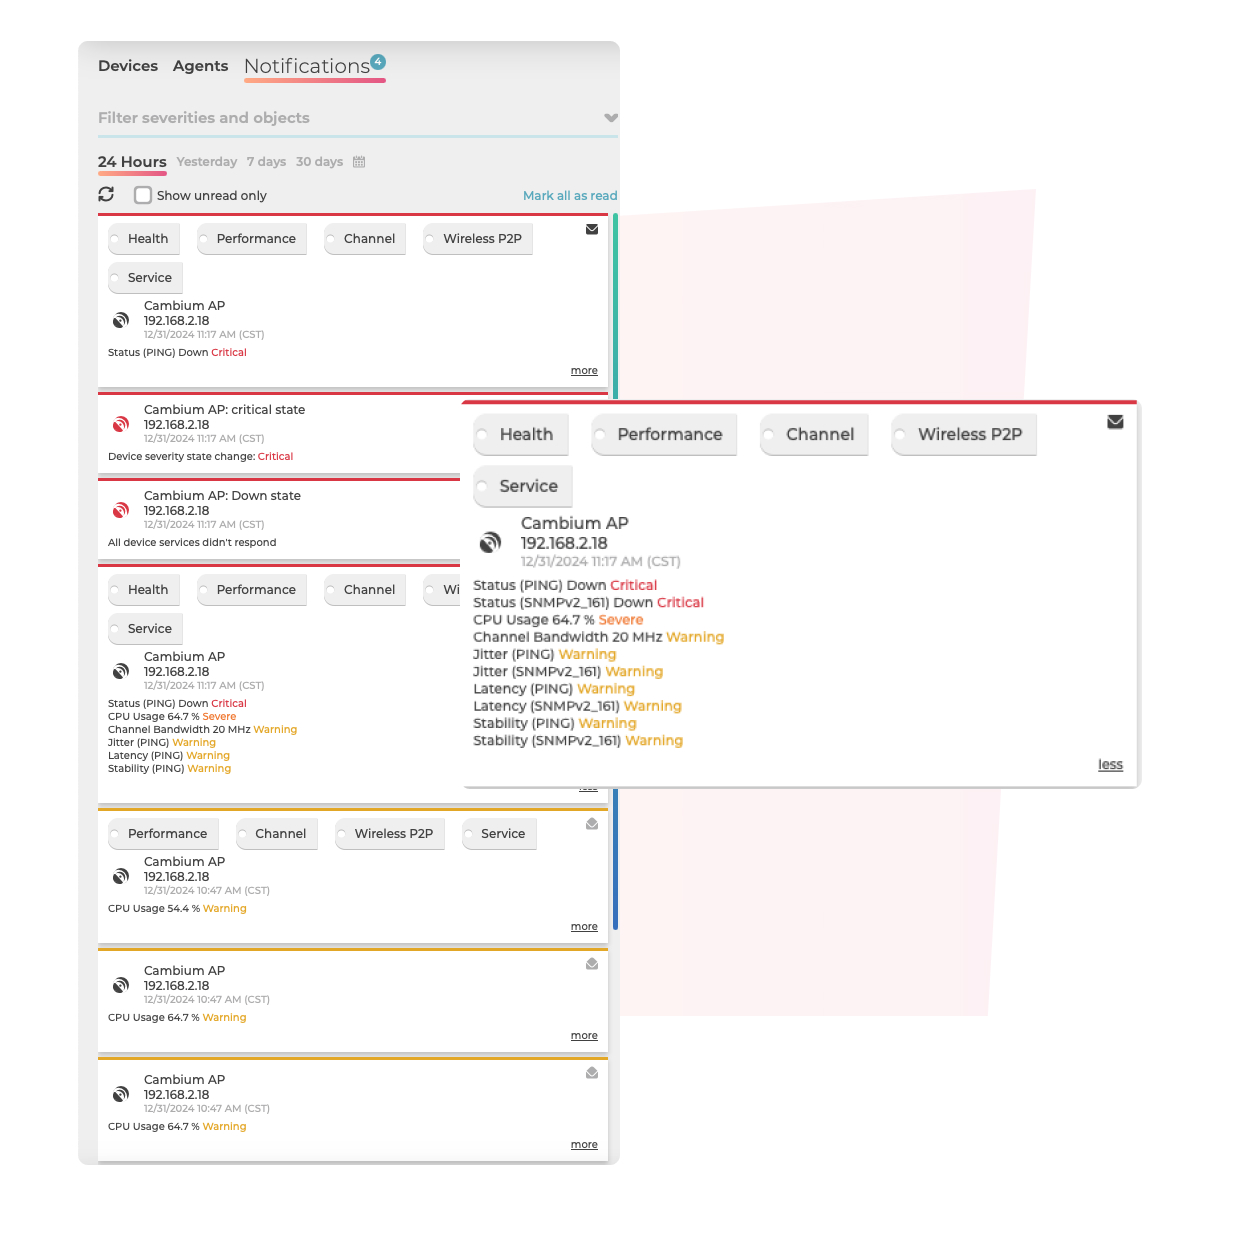
  • Comprehensive Logging: All system notifications are logged and easily searchable, enabling users to track and analyze historical trends.
  • Pattern Detection: Identify recurring issues, such as consistent RSSI warnings for specific radios, to investigate root causes like interference or misaligned antennas.
  • Customizable Filters: Use notification filters to view specific alerts by severity level, device type, or properties, simplifying trend identification.
  • Proactive Problem-Solving: Gain actionable insights to address recurring issues before they escalate into larger problems.
Notifications-wisps-2
Powerful Severity Rules Engine: Detect Outliers with Precision
  • Customizable Severity Rules: Temporarily configure rules to automatically highlight outliers in your network.
  • Low Port Speeds: Flag ports running at 100 Mbps instead of 1 Gbps for immediate attention.
  • Unsupported Firmware: Identify devices with outdated firmware to ensure security and performance improvements.
  • Flexible Metrics: Monitor additional metrics like channel utilization, SNR, or CPU/memory usage.
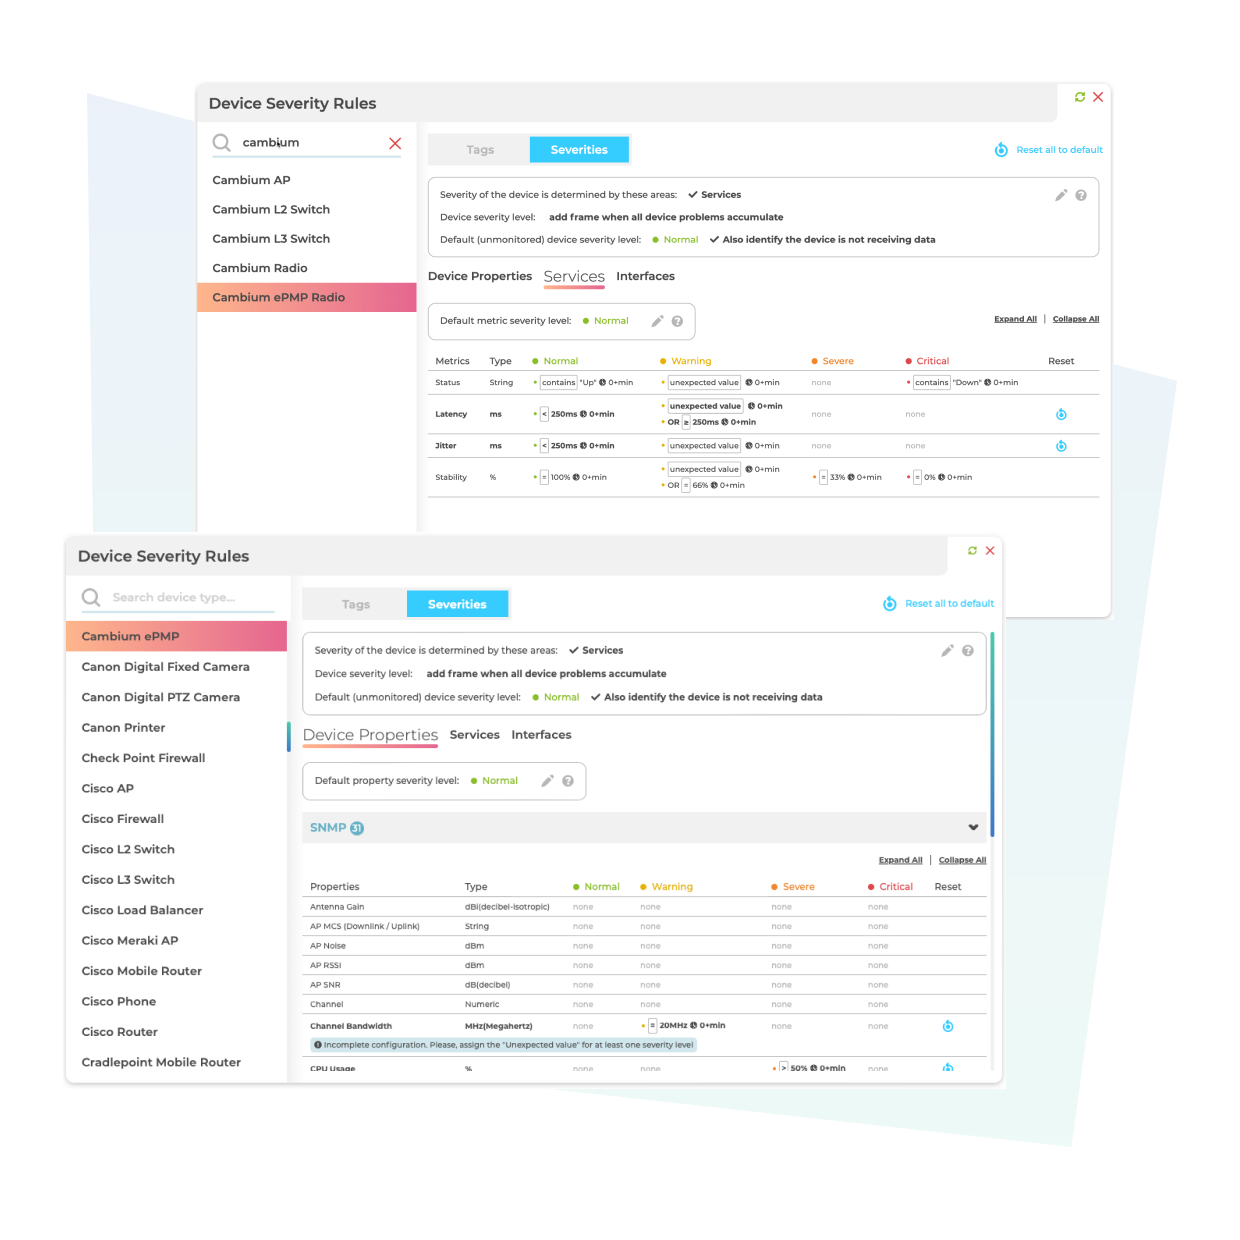
Severities-wisps-2
Unlock Hidden Insights with Historical Data Tracking
  • Flexible Data Retention: Track and store device and network performance data for 7 days, 30 days, or custom durations to support detailed trend analysis.
  • Recurring Issue Detection: Identify patterns like radios with low RSSI during peak hours or links with frequent high traffic utilization.
  • Comprehensive Logs: Access detailed records of device state changes to trace root causes of persistent problems.
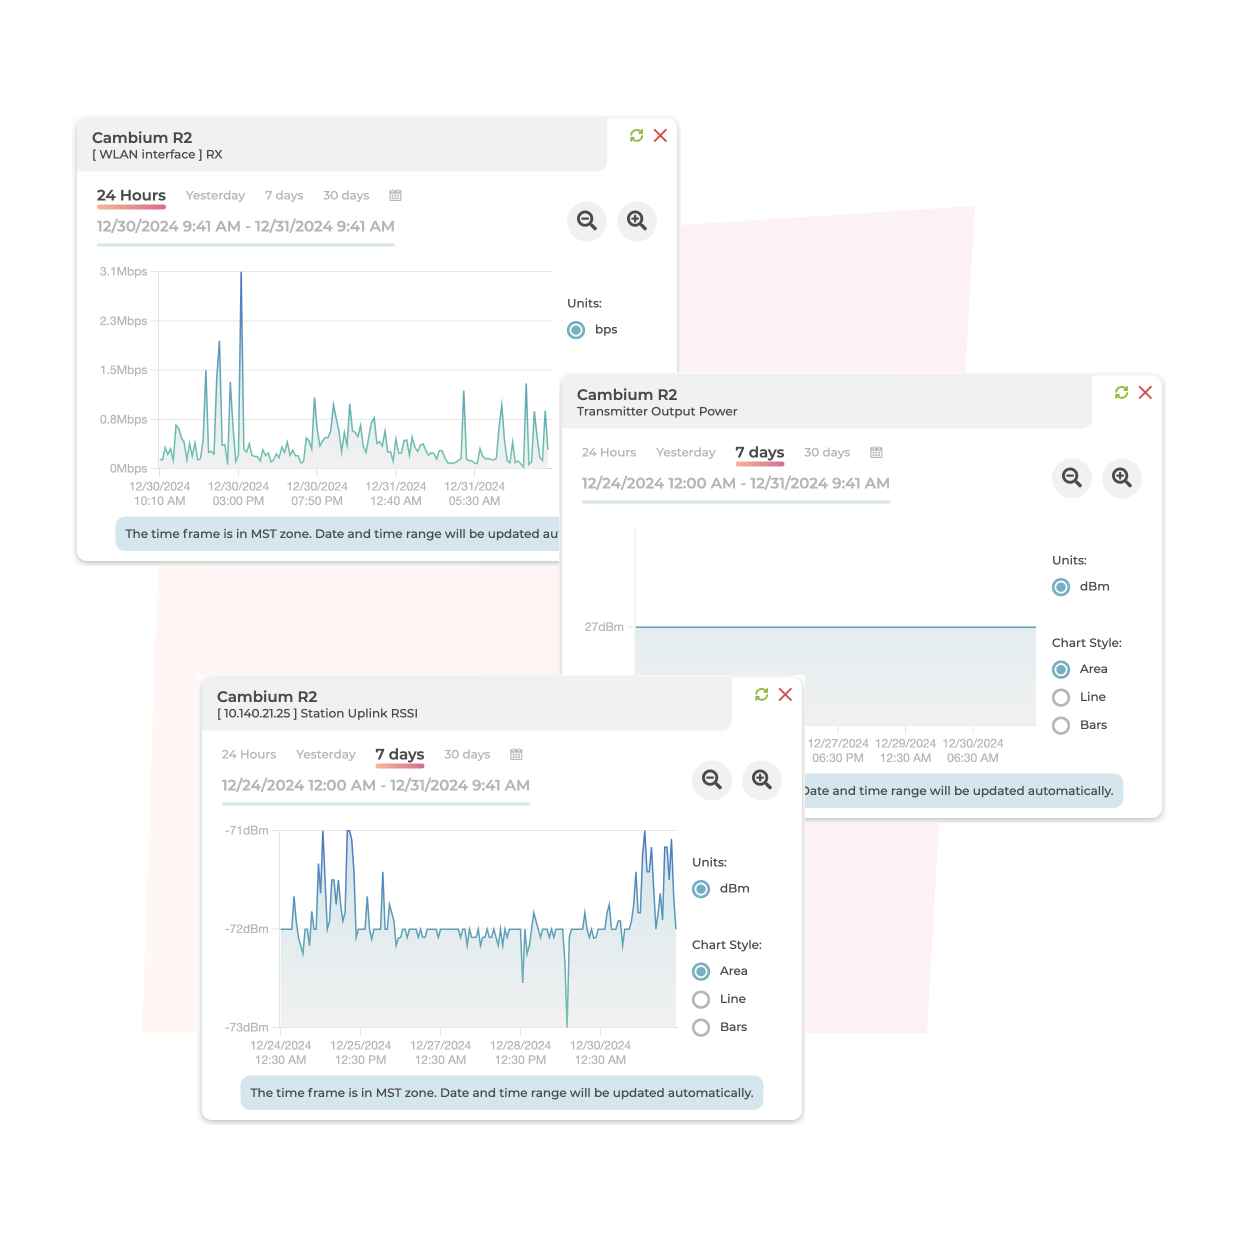
historical-wisps-1

Real-Time Dashboards for Proactive Monitoring
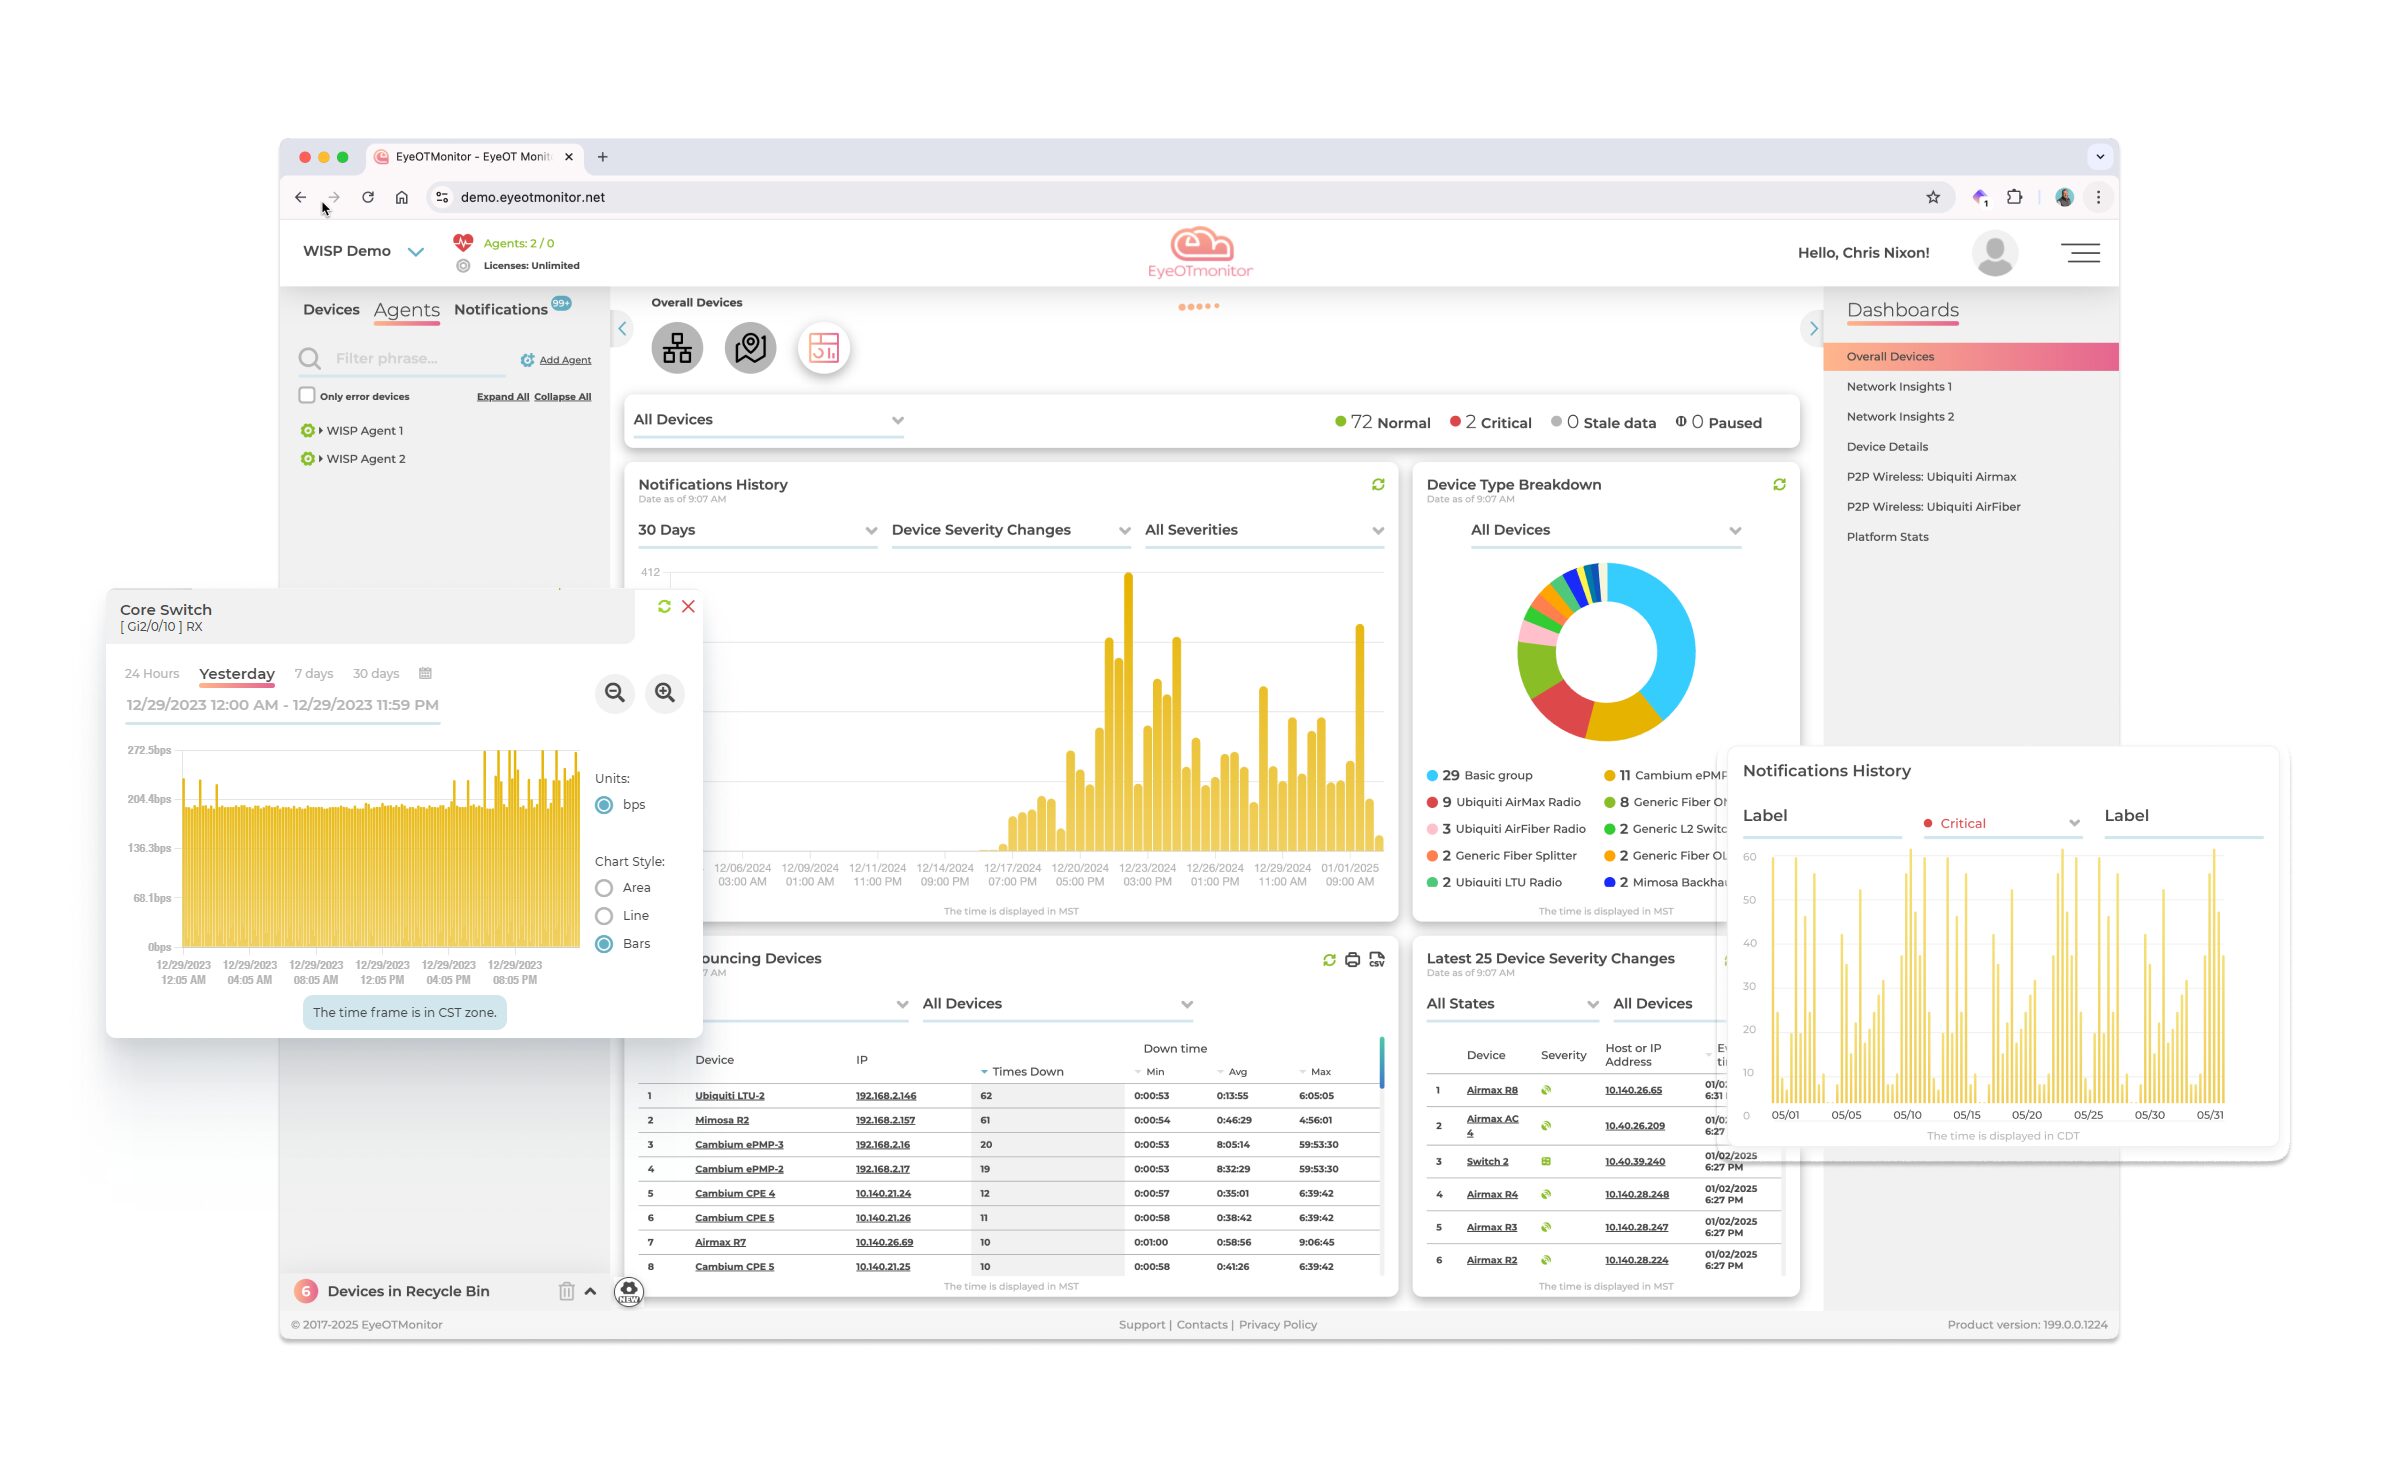
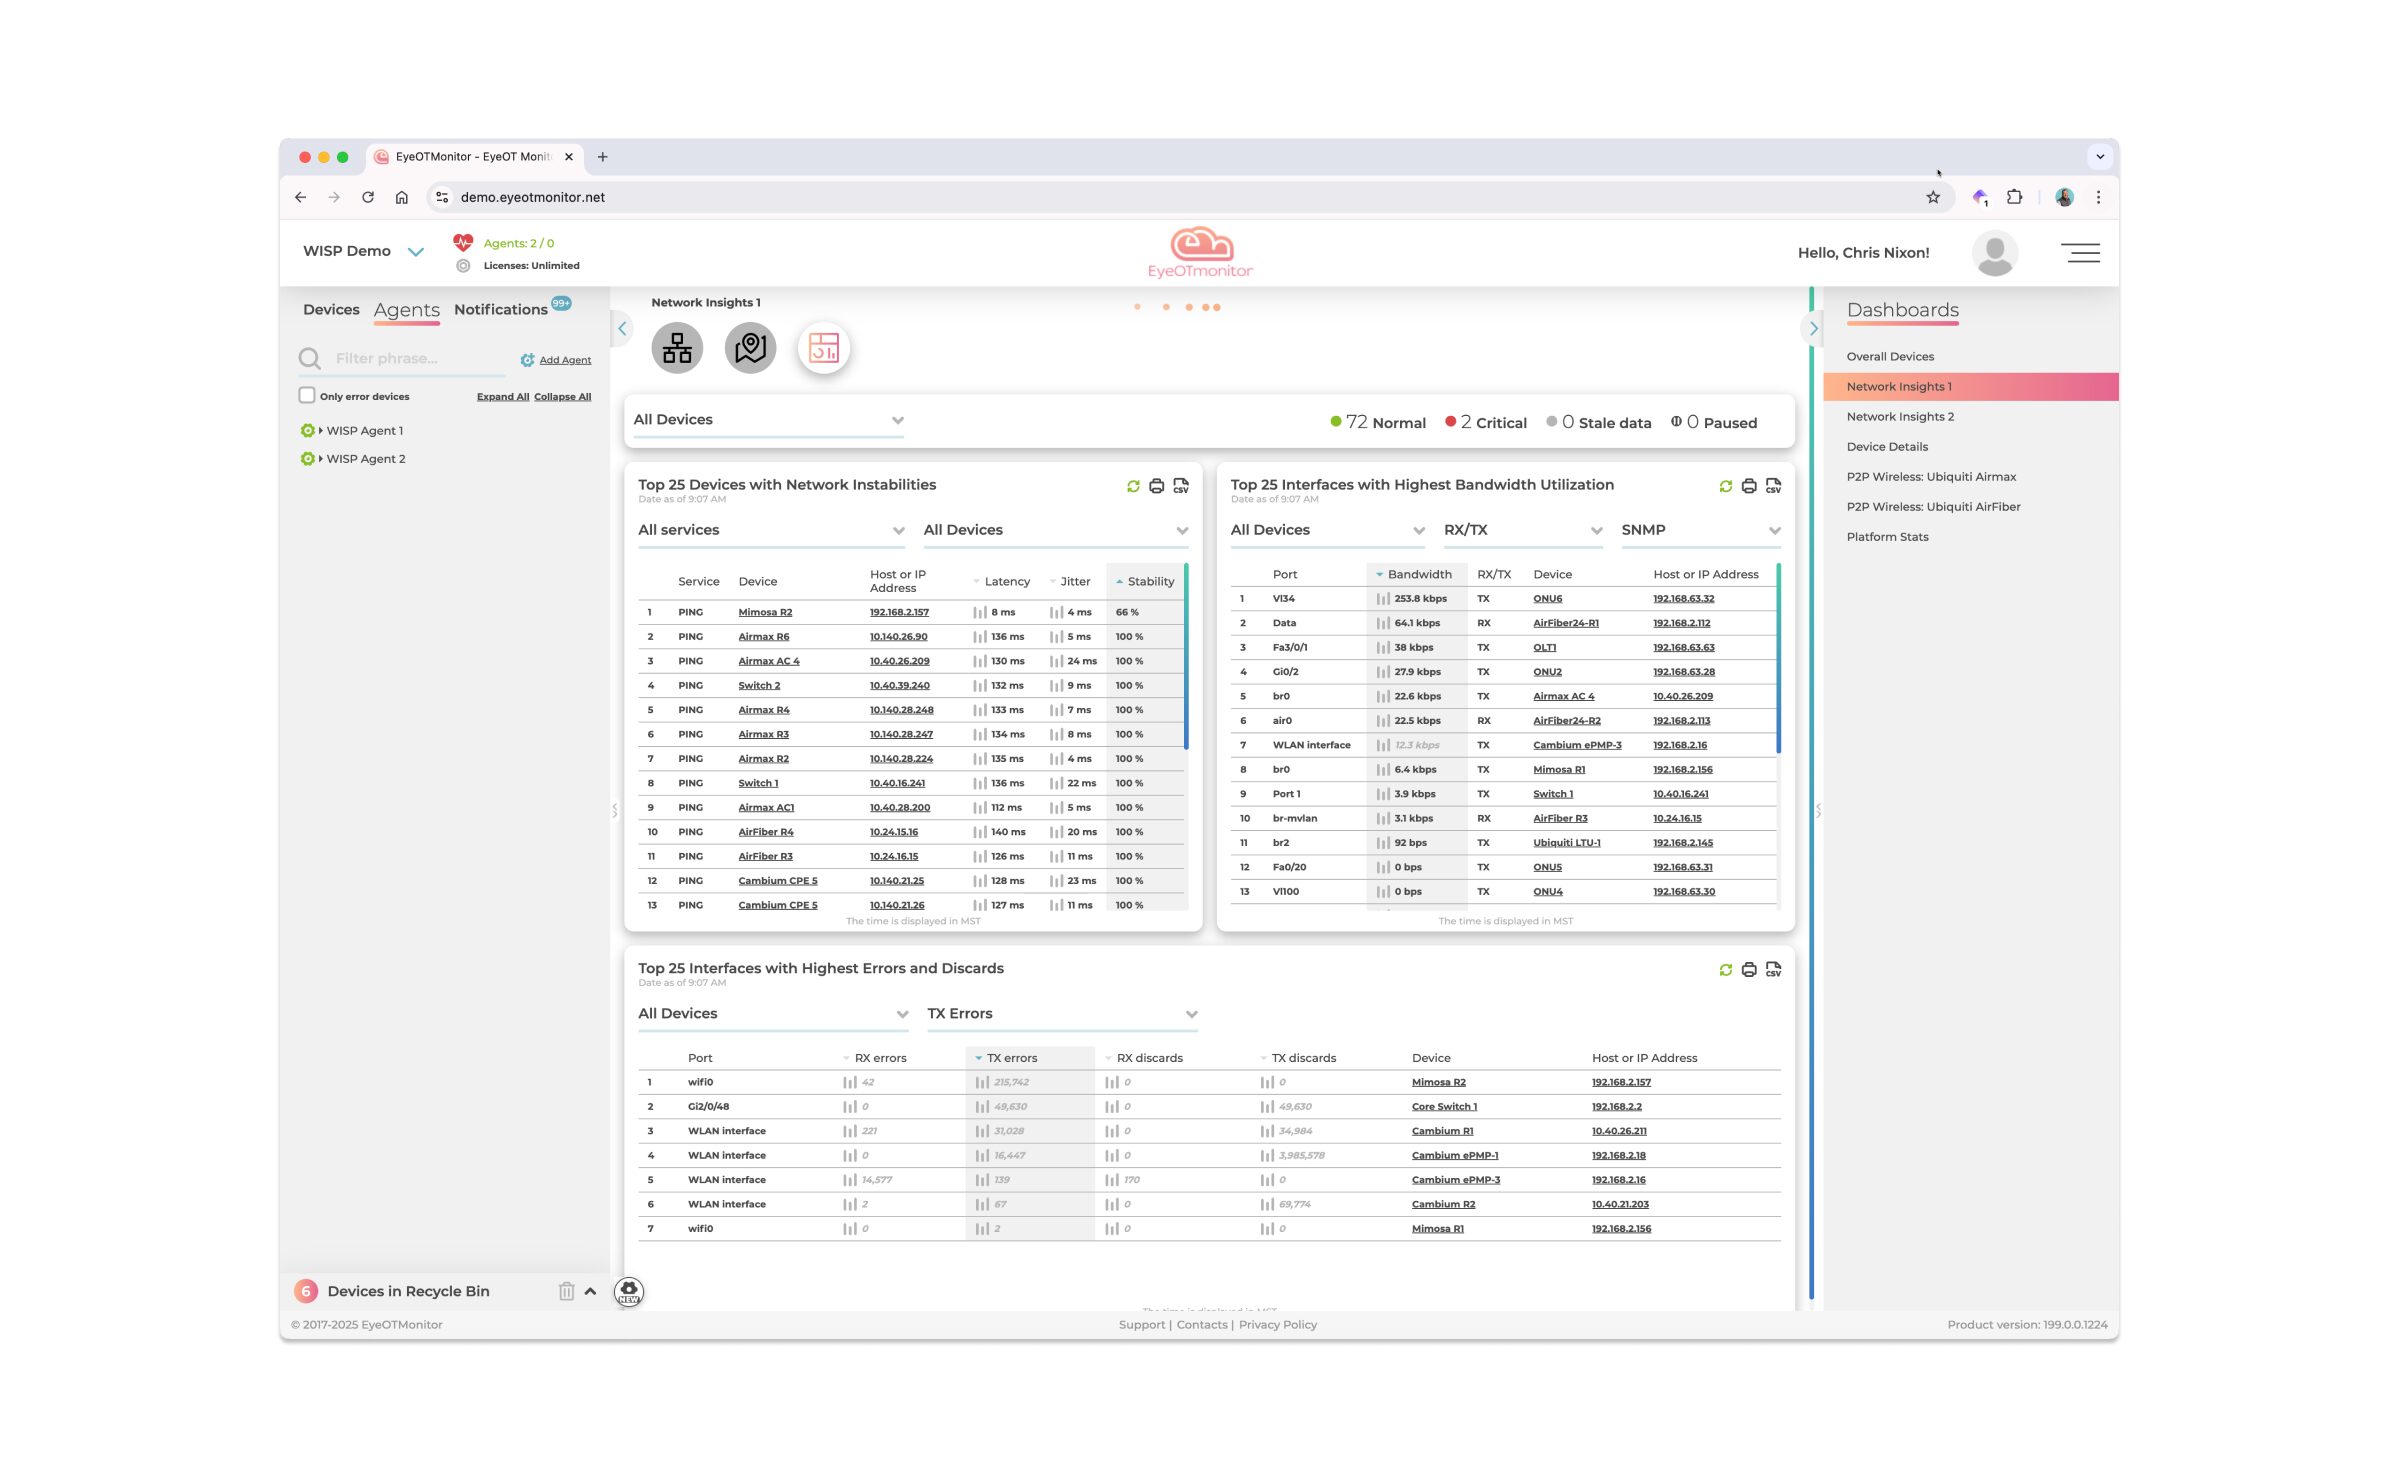
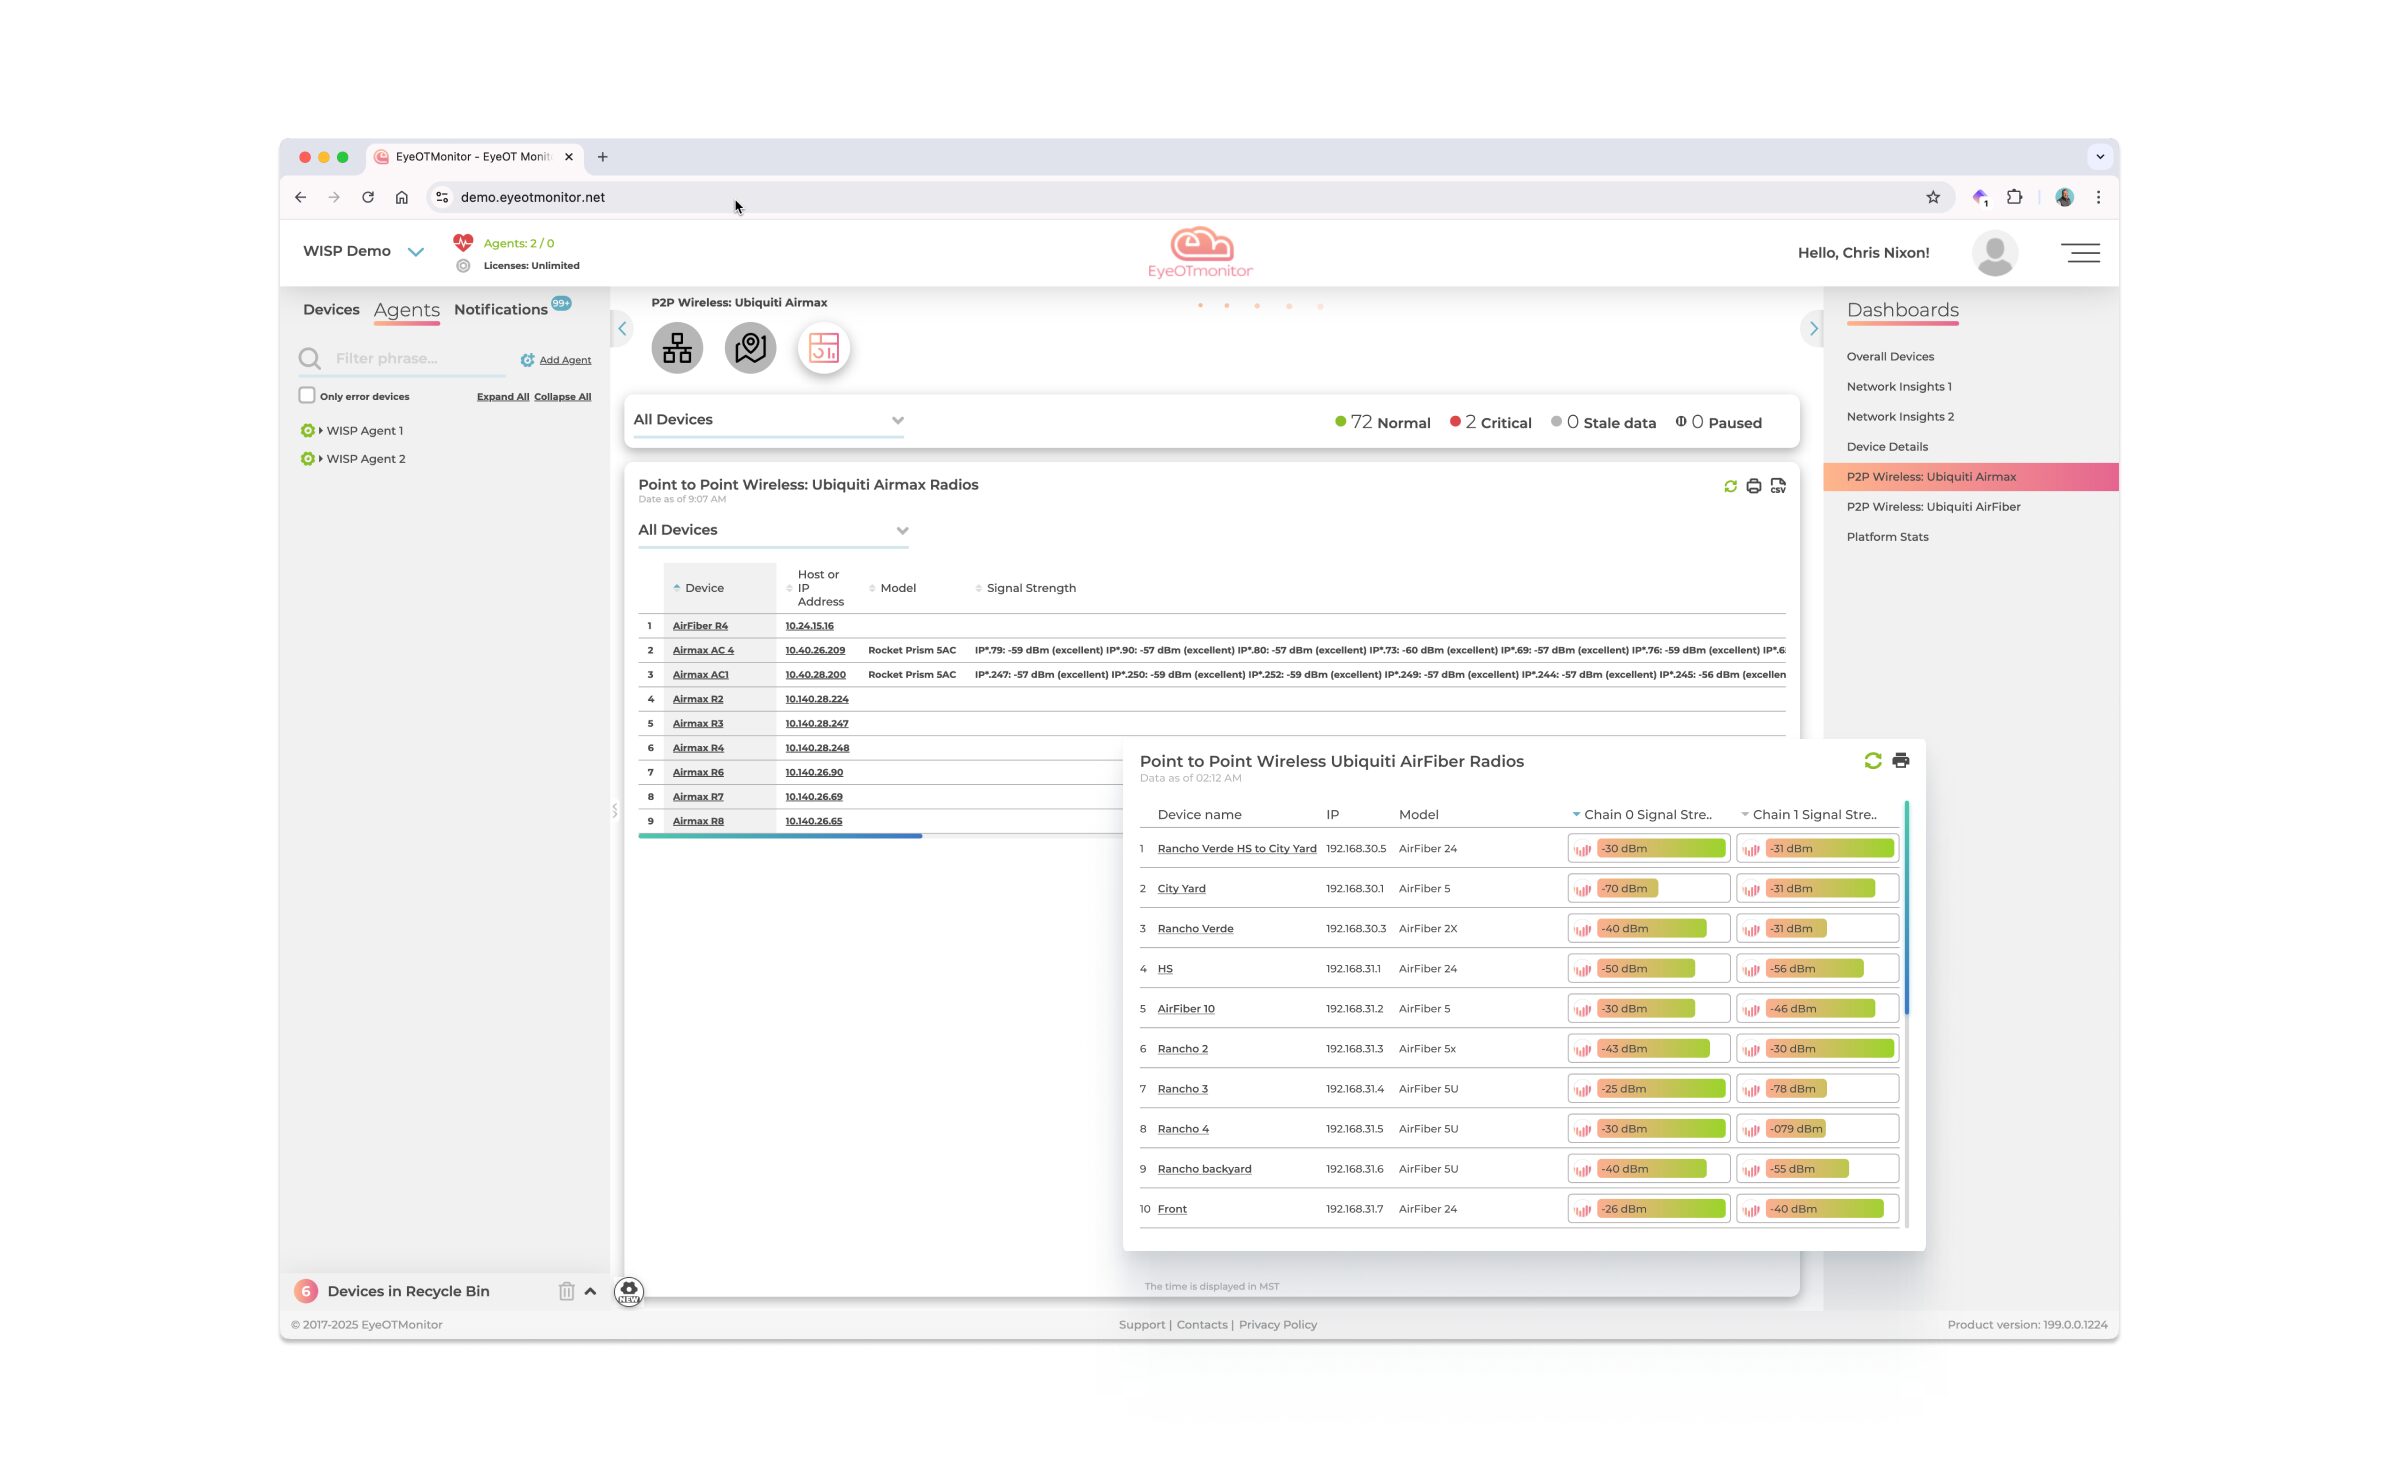
EyeOTmonitor’s dashboards are tailored to meet the specific needs of WISPs, providing a comprehensive view of network health, performance, and actionable insights.
How WISPs Leverage Dashboards for Smarter Operations
Port Flapping in Backhaul Links
A key backhaul link between towers suffers intermittent port flapping, briefly disconnecting hundreds of customers. The dashboard flags the issue, and historical data shows a pattern, enabling engineers to swiftly fix hardware or adjust settings.
Optimizing Customer-Premises Equipment (CPE)
Monitoring RSSI and SNR helps WISPs spot weak signals or interference. Dashboards simplify pinpointing issues, enabling proactive technician dispatch for adjustments.
Load Balancing for Peak Traffic
Dashboards highlight which links or APs are consistently over-utilized during peak hours. By analyzing historical trends, WISPs can redistribute traffic or deploy additional capacity in high-demand areas.
Latency and Jitter
Pinpoint links with high latency and jitter that impact real-time applications like VoIP or video streaming, ensuring a smooth customer experience.