Dashboards & Reports: Complete Network & Device Visibility
From Dashboards to Decisions
See what’s happening across your system, understand what matters, and act faster. EyeOTmonitor turns raw data into real operational insight.
The Challenge
Data Without Clarity Creates a Lot of Noise
Teams drown in endless event logs, raw SNMP traps, and device alerts with no clear context. Without easy-to-read dashboards and automated reporting, critical issues get buried under noise, and leadership lacks the visibility needed to make fast, informed decisions.
The impact
Missed Issues
Critical events slip through cluttered logs
Inefficient Troubleshooting
Teams waste time piecing together context manually
Customer Confusion
No professional reports to share with clients or stakeholders
Interactive Demo
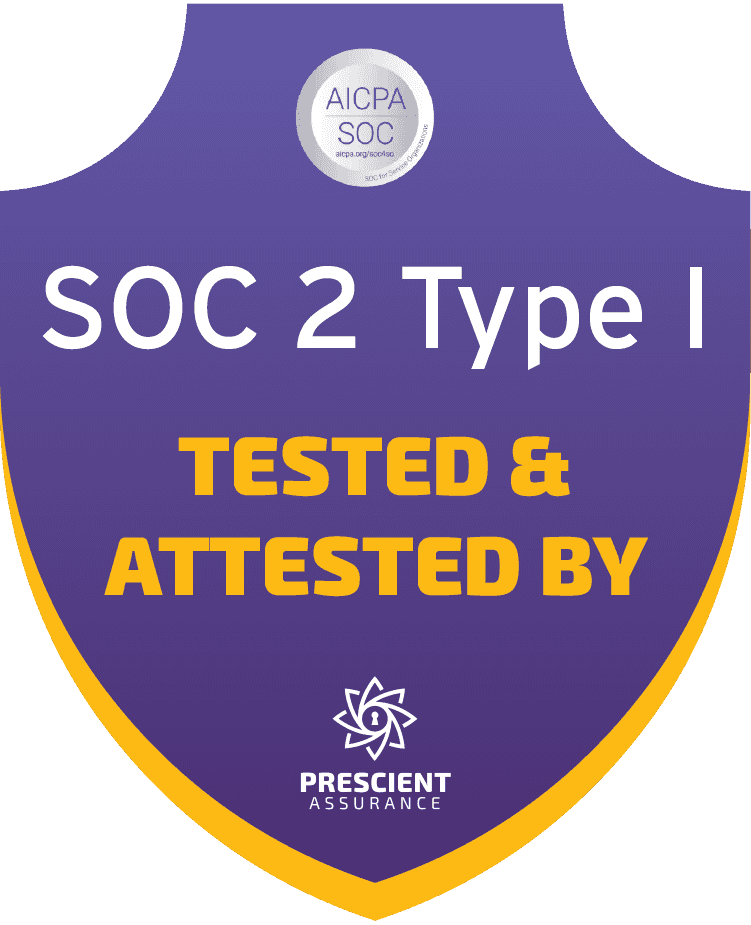
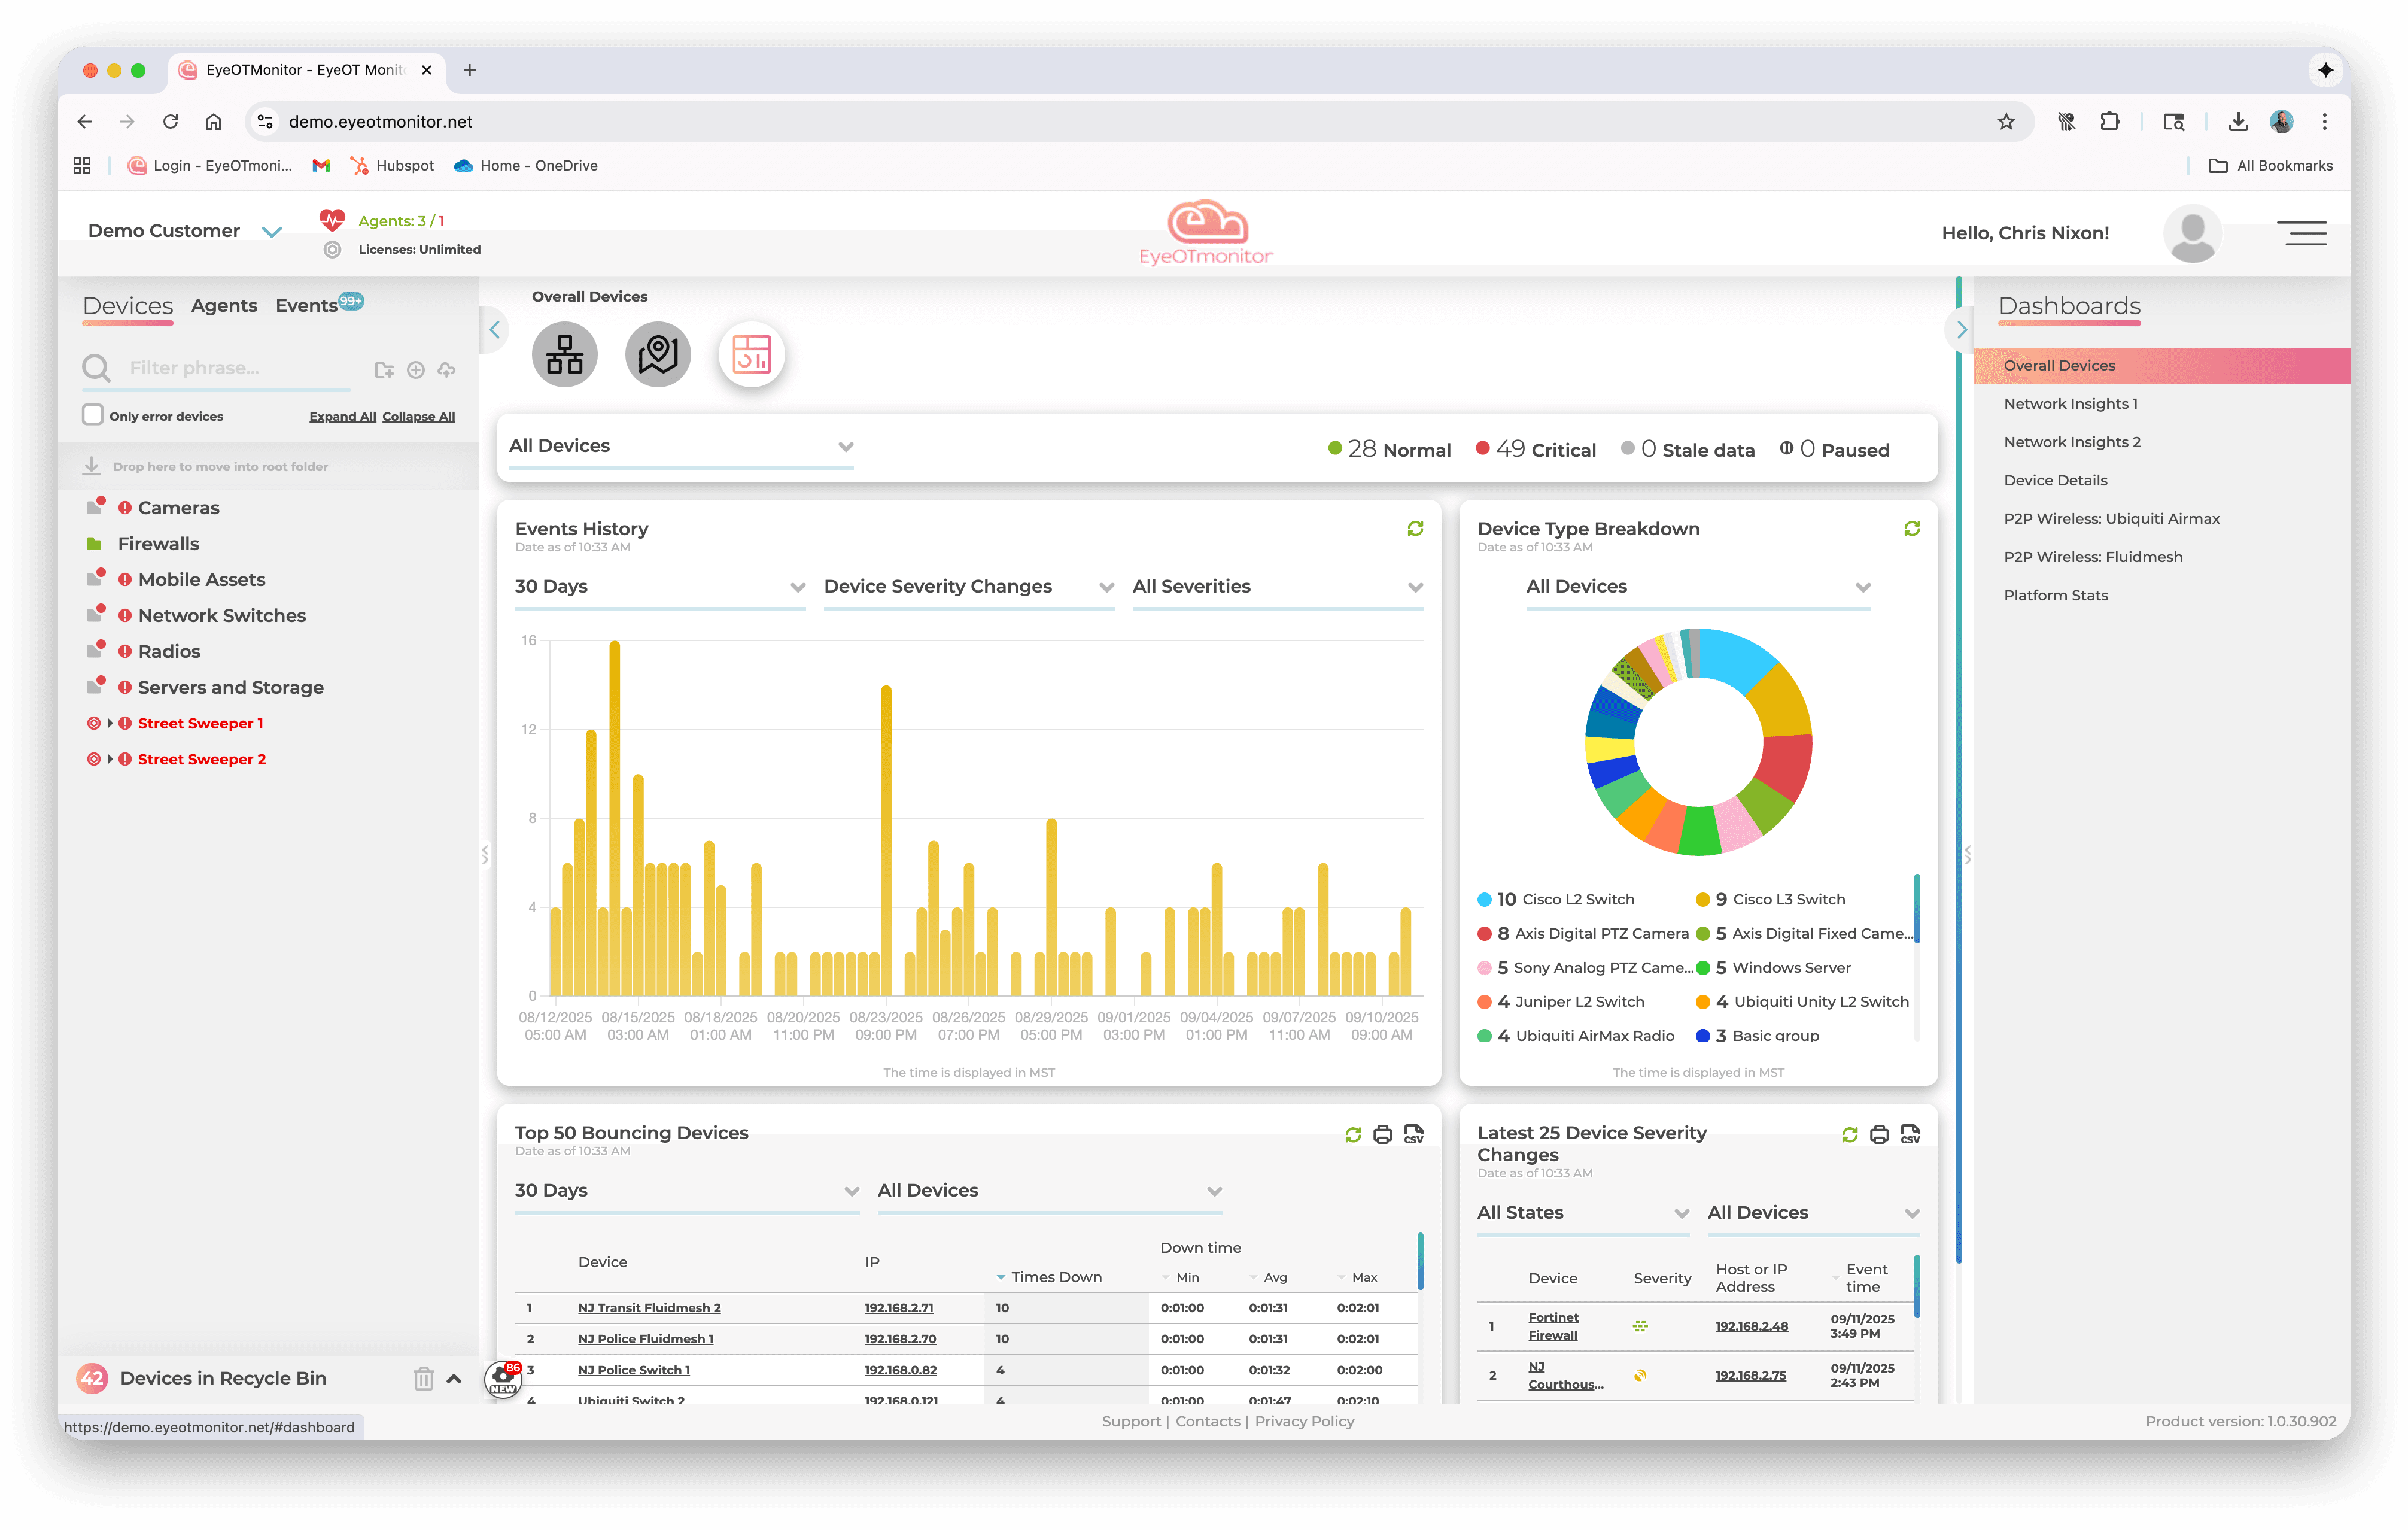
Real-time Dashboards and Automated Reporting
EyeOTmonitor transforms raw network and device data into clean, interactive dashboards and scheduled reports. Whether you’re troubleshooting in real time or presenting results to leadership, you’ll always have the right view at the right time.


What You Gain
Clarity, speed, and confidence in every decision

Real-time situational awareness
Custom dashboards deliver instant visibility into network and device health, helping teams spot and resolve issues before they escalate.

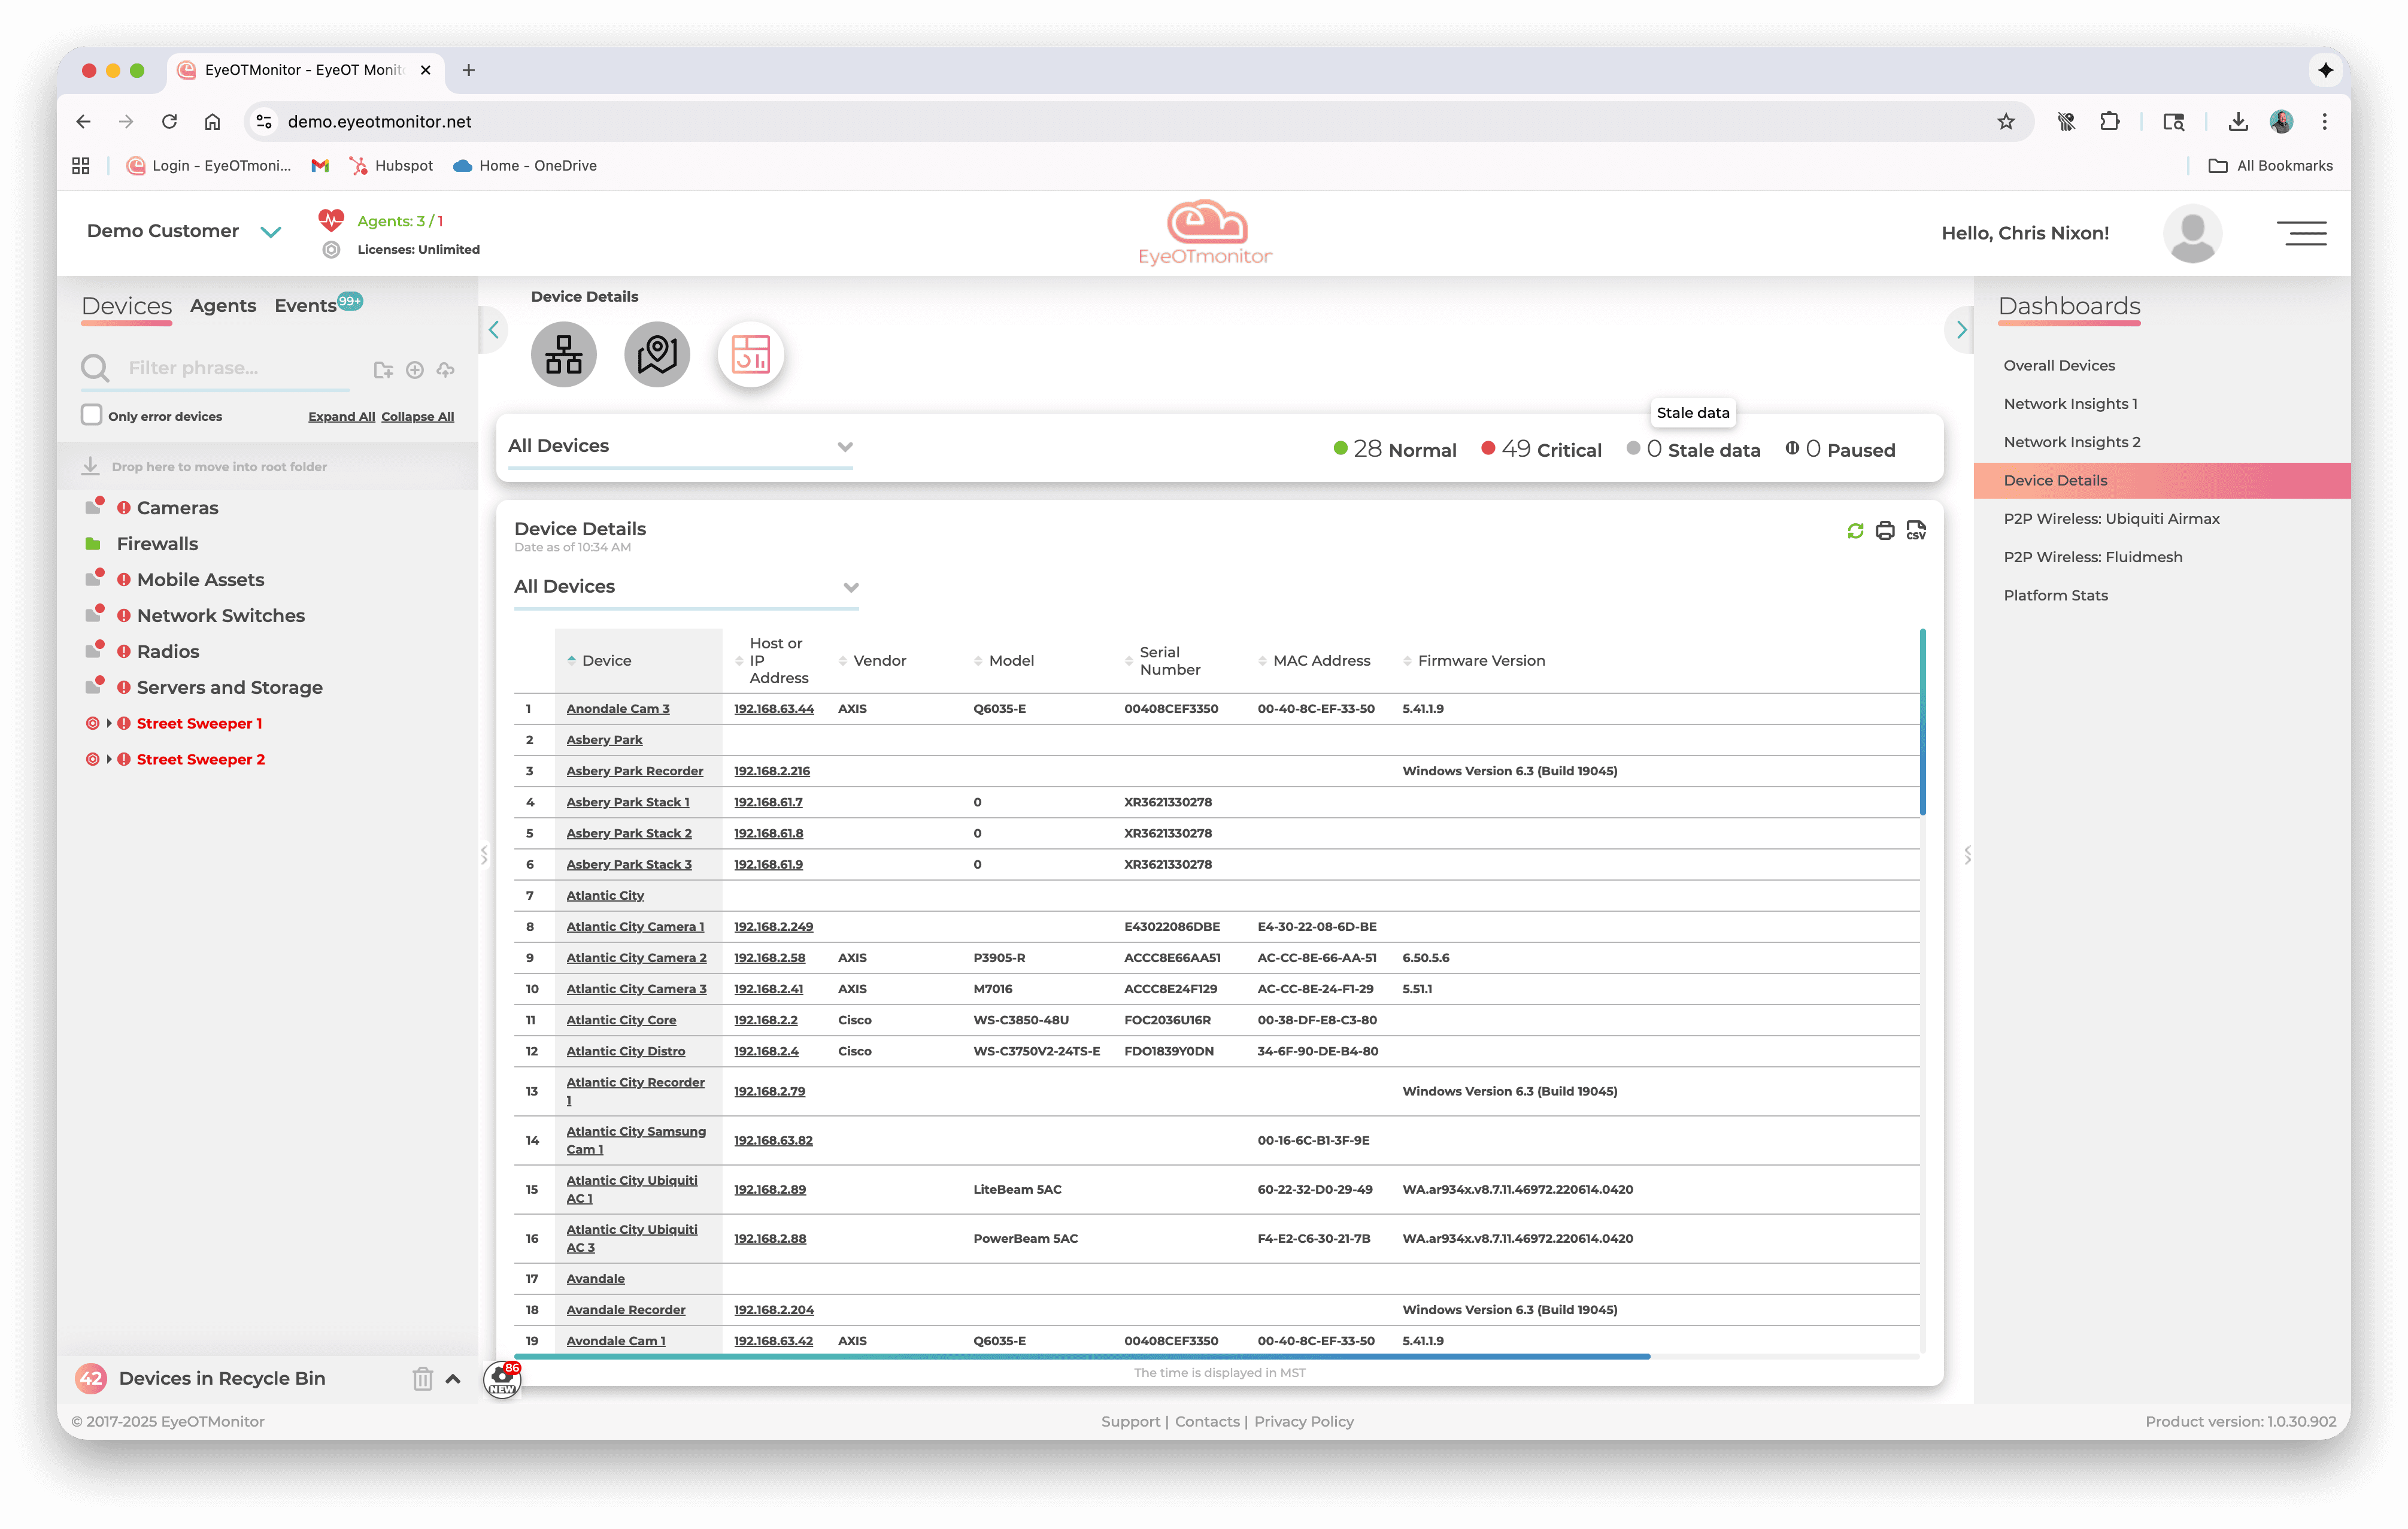
Noise reduction & focus
Events, alerts, and device health metrics are correlated visually, so teams spend less time sifting through noise and more time solving real problems.

Stronger client communication
Professional, branded reports showcase value to customers and keep them informed without overwhelming technical detail.

Root Cause Clarity
Dashboards connect events, alerts, and device health data so teams can trace issues back to their source in seconds. Instead of chasing symptoms across logs, you see the complete story of what happened, where, and why.