New EyeOTmonitor Dashboards: Clearer KPIs for Camera Health, VMS, and Network Performance
Blog
•
4 minute read

When teams manage hundreds or thousands of cameras, recorders, and network devices, visibility can’t live in spreadsheets or one-off reports. It needs to be immediate, consistent, and easy to act on.
That’s why we’ve released new EyeOTmonitor dashboards - designed to make it faster to build, deploy, and customize KPI-driven views across camera health, VMS performance, inventory, and network stability.
These dashboards turn raw monitoring data into operational clarity, without forcing teams to stitch together multiple tools.
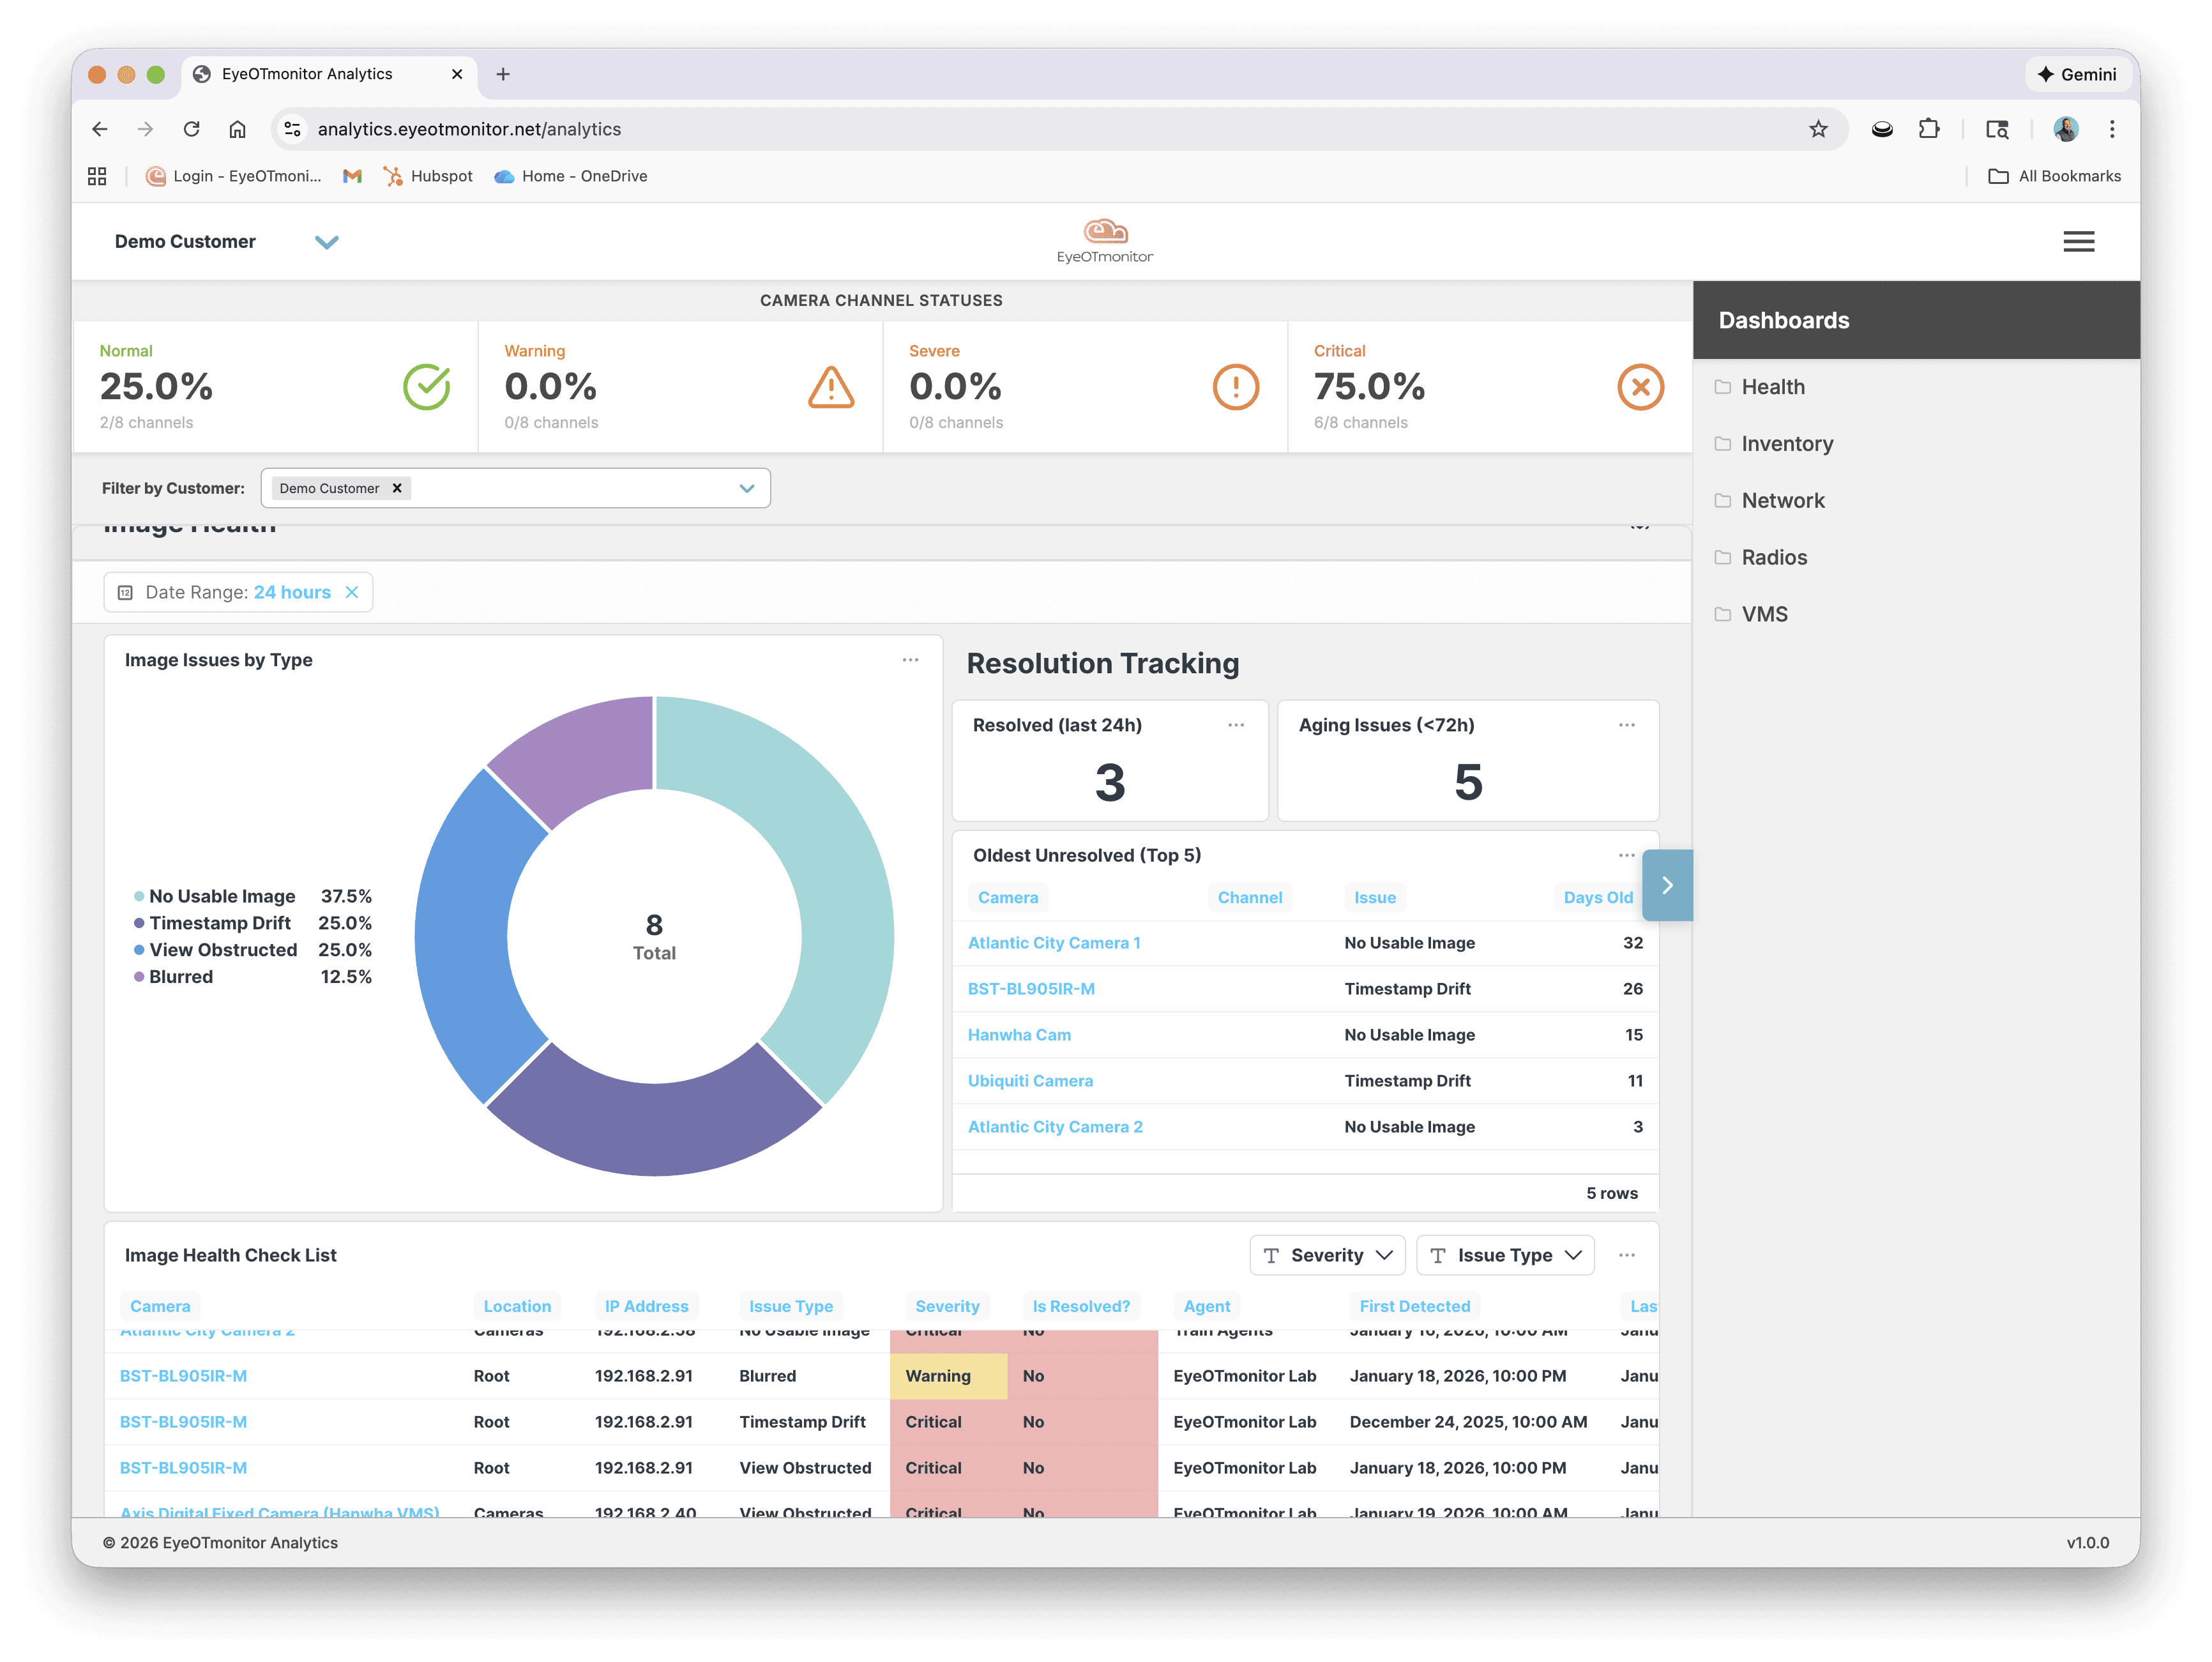
Camera Health Dashboards That Go Beyond “Online”
A camera being online doesn’t mean it’s usable.
The new Camera Image Health dashboards surface exactly what’s wrong with video streams — and how widespread those issues really are.
With these dashboards, teams can instantly see:
- Image issues broken down by type, such as no usable image, timestamp drift, obstruction, or blur
- Severity-based health status across all camera channels
- Aging issues and unresolved problems that have been impacting operations the longest
- Resolution trends showing what’s getting fixed and what’s being ignored
Instead of reacting to individual alerts, operators get a system-level view of image quality across sites, regions, or customers.
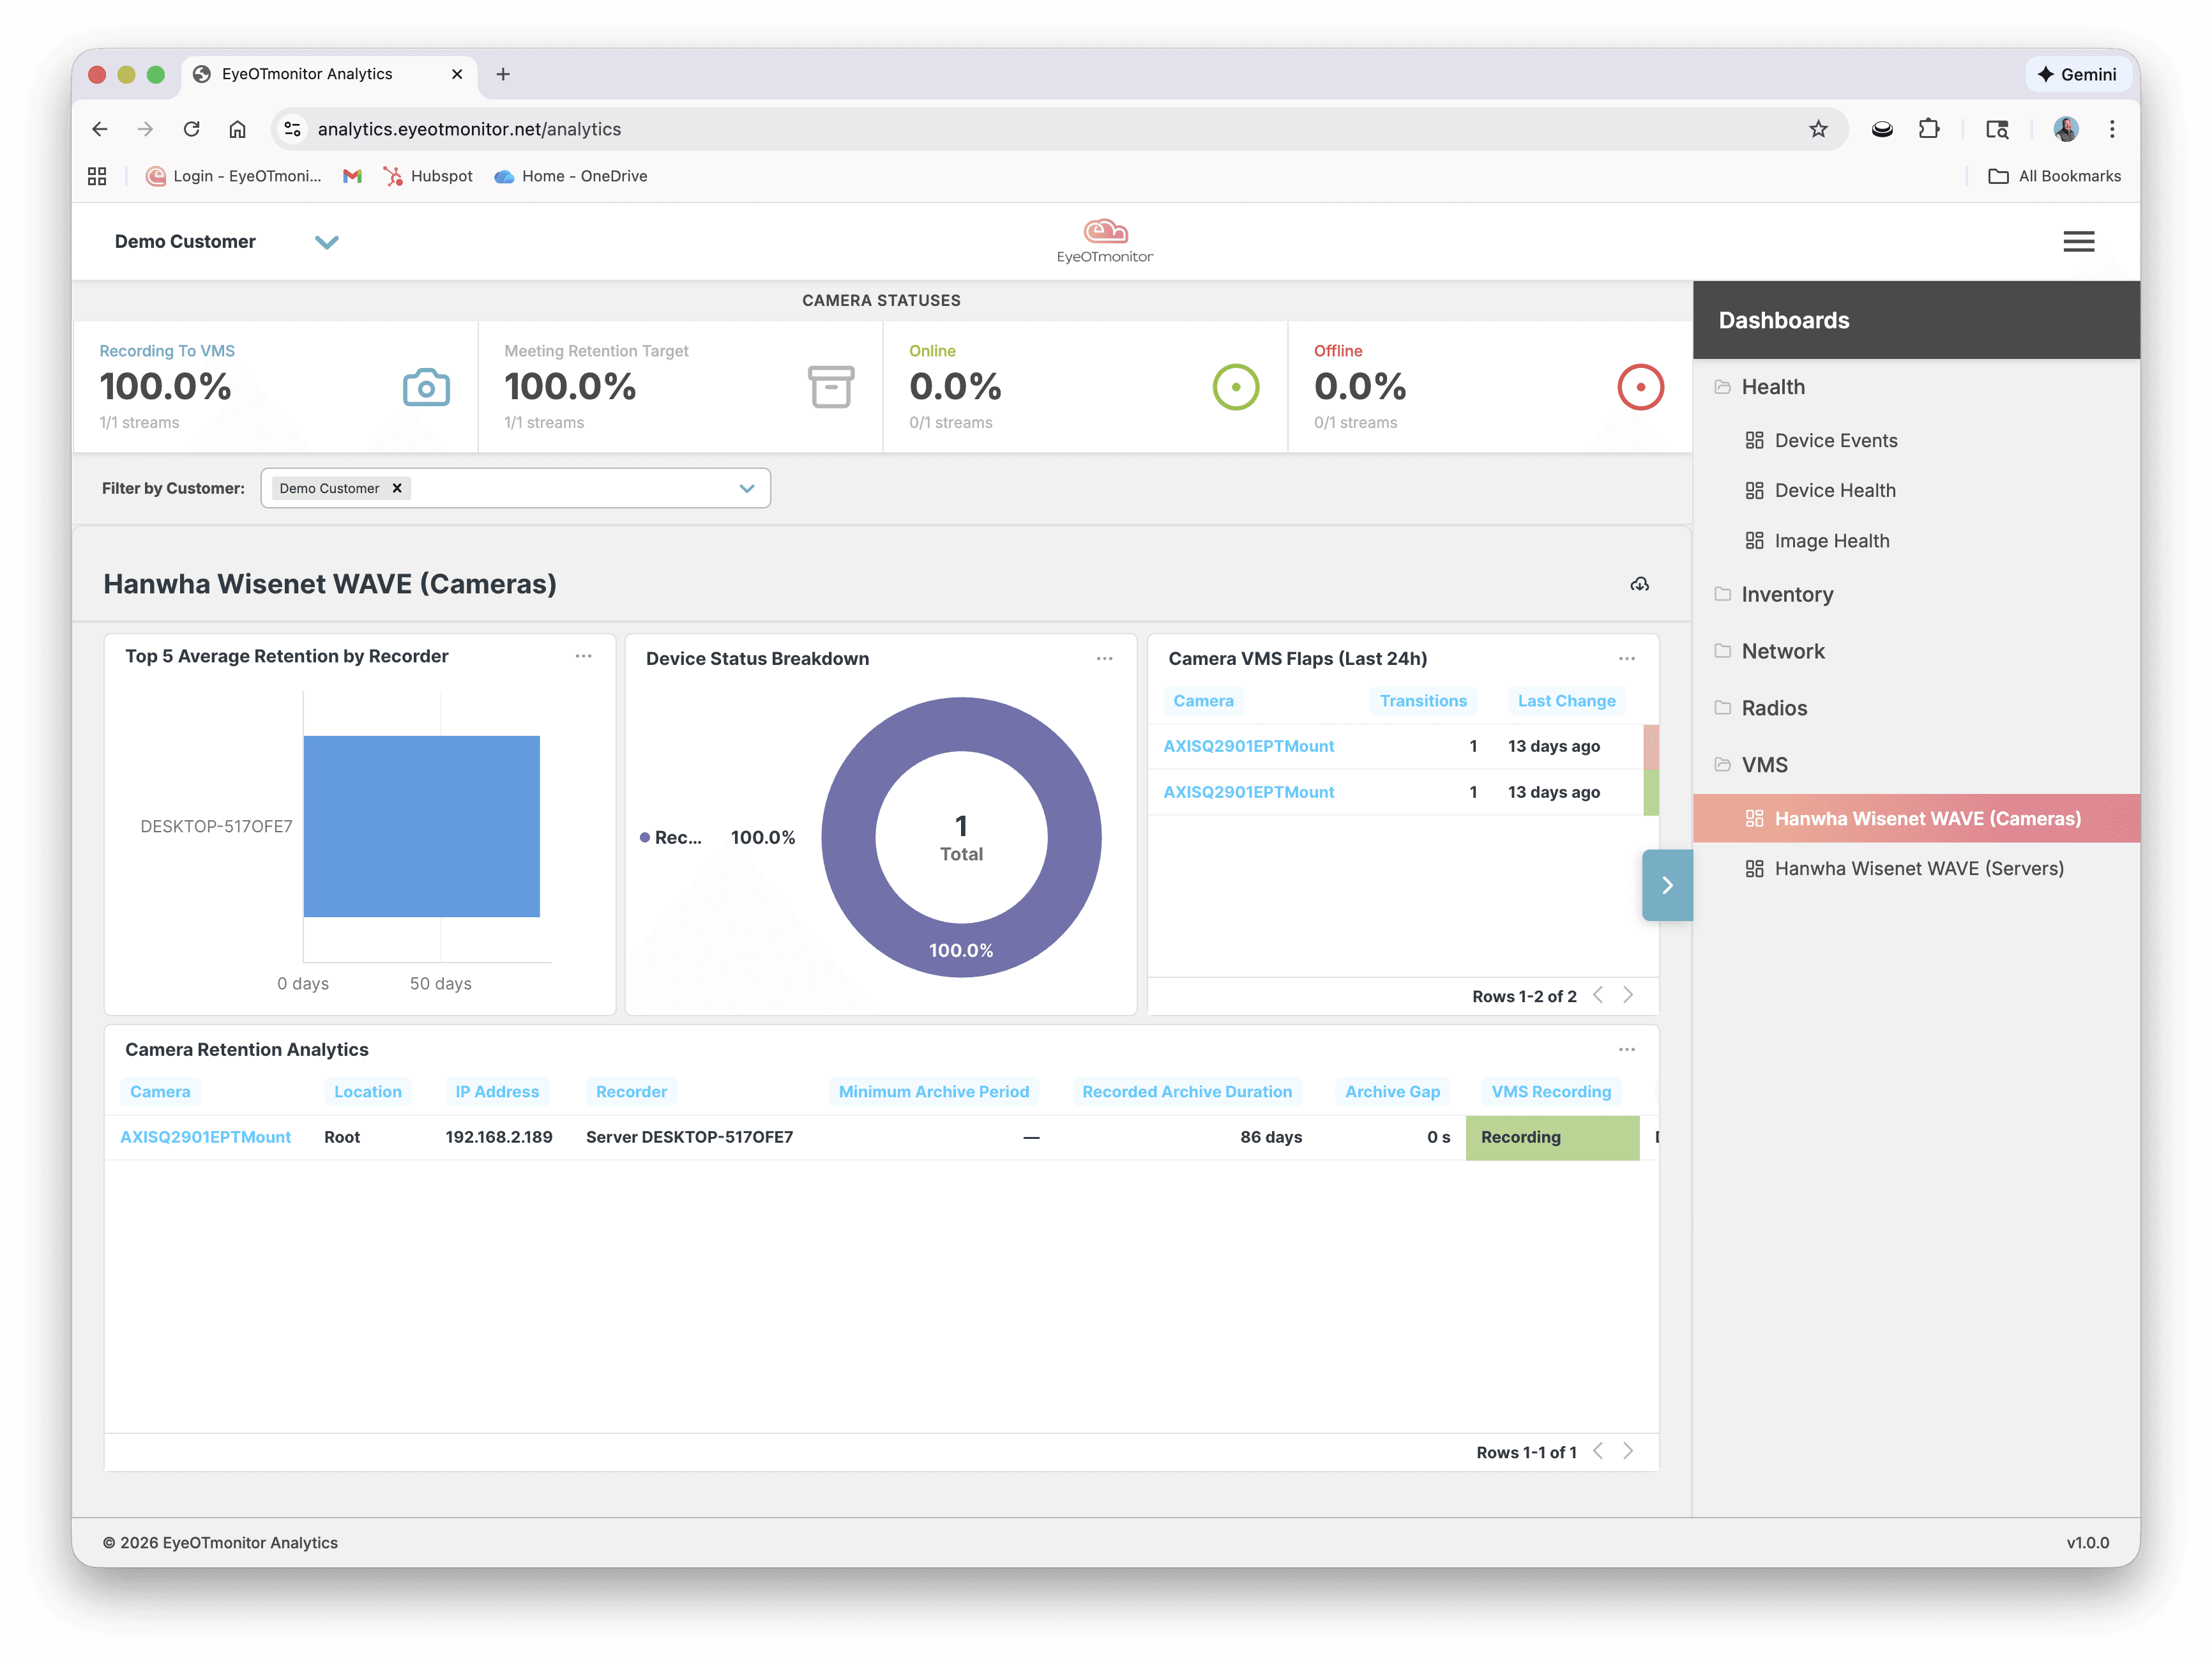
VMS-Specific Dashboards with Real Operational Context
Video systems don’t exist in isolation. That’s why we introduced VMS-specific dashboards, including dedicated views for platforms like Hanwha Wisenet WAVE.
These dashboards make it easy to track:
- Whether cameras are actively recording to the VMS
- Archive retention performance and gaps
- Camera and recorder status from the VMS perspective
- Recording stability and recent VMS flaps
By tying VMS data directly into EyeOTmonitor, teams can quickly answer questions like:
- Are cameras recording correctly?
- Are retention targets being met?
- Is an issue coming from the camera, the recorder, or the network path between them?
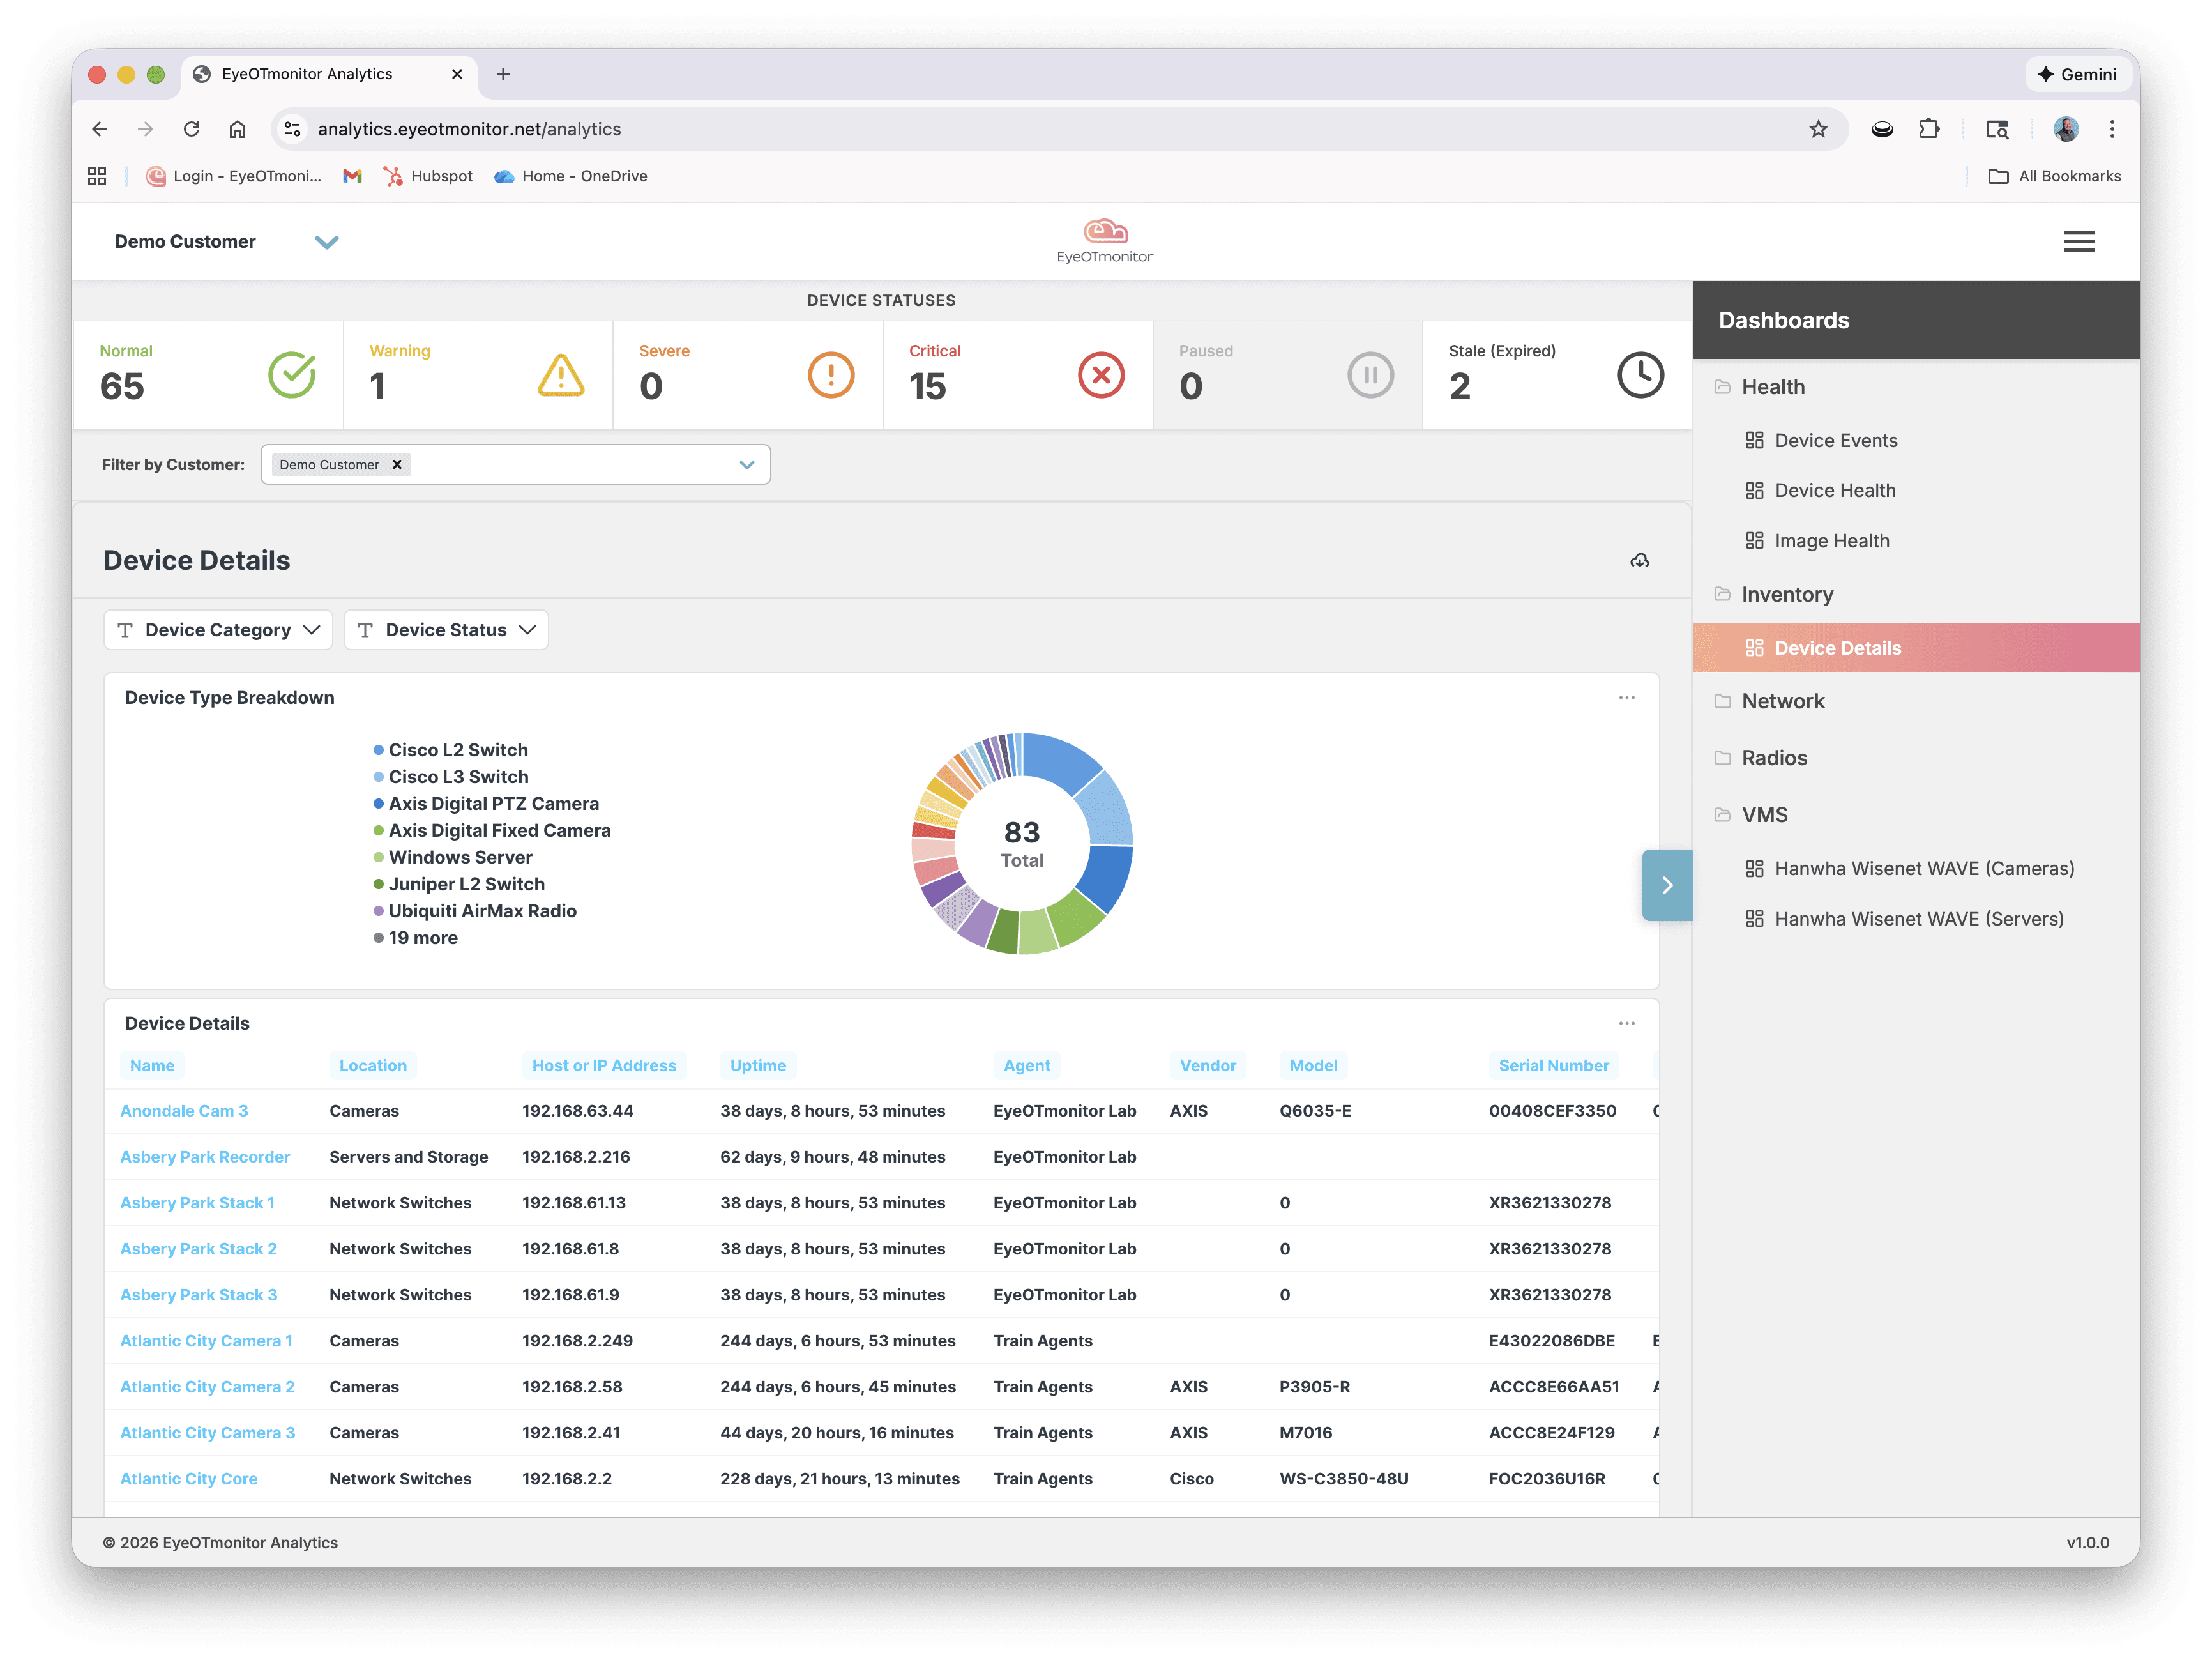
Inventory and Device Health at a Glance
Large environments fail quietly when device sprawl isn’t visible.
The new Inventory and Device Health dashboards give teams a single view of everything being monitored - cameras, switches, servers, radios, and more.
From these dashboards, operators can:
- See device health status across all monitored categories
- Break down inventory by vendor, model, and device type
- Identify critical or stale devices before they cause outages
- Quickly drill into uptime, agent status, and hardware details
This makes EyeOTmonitor not just a monitoring tool, but a living source of truth for system inventory.
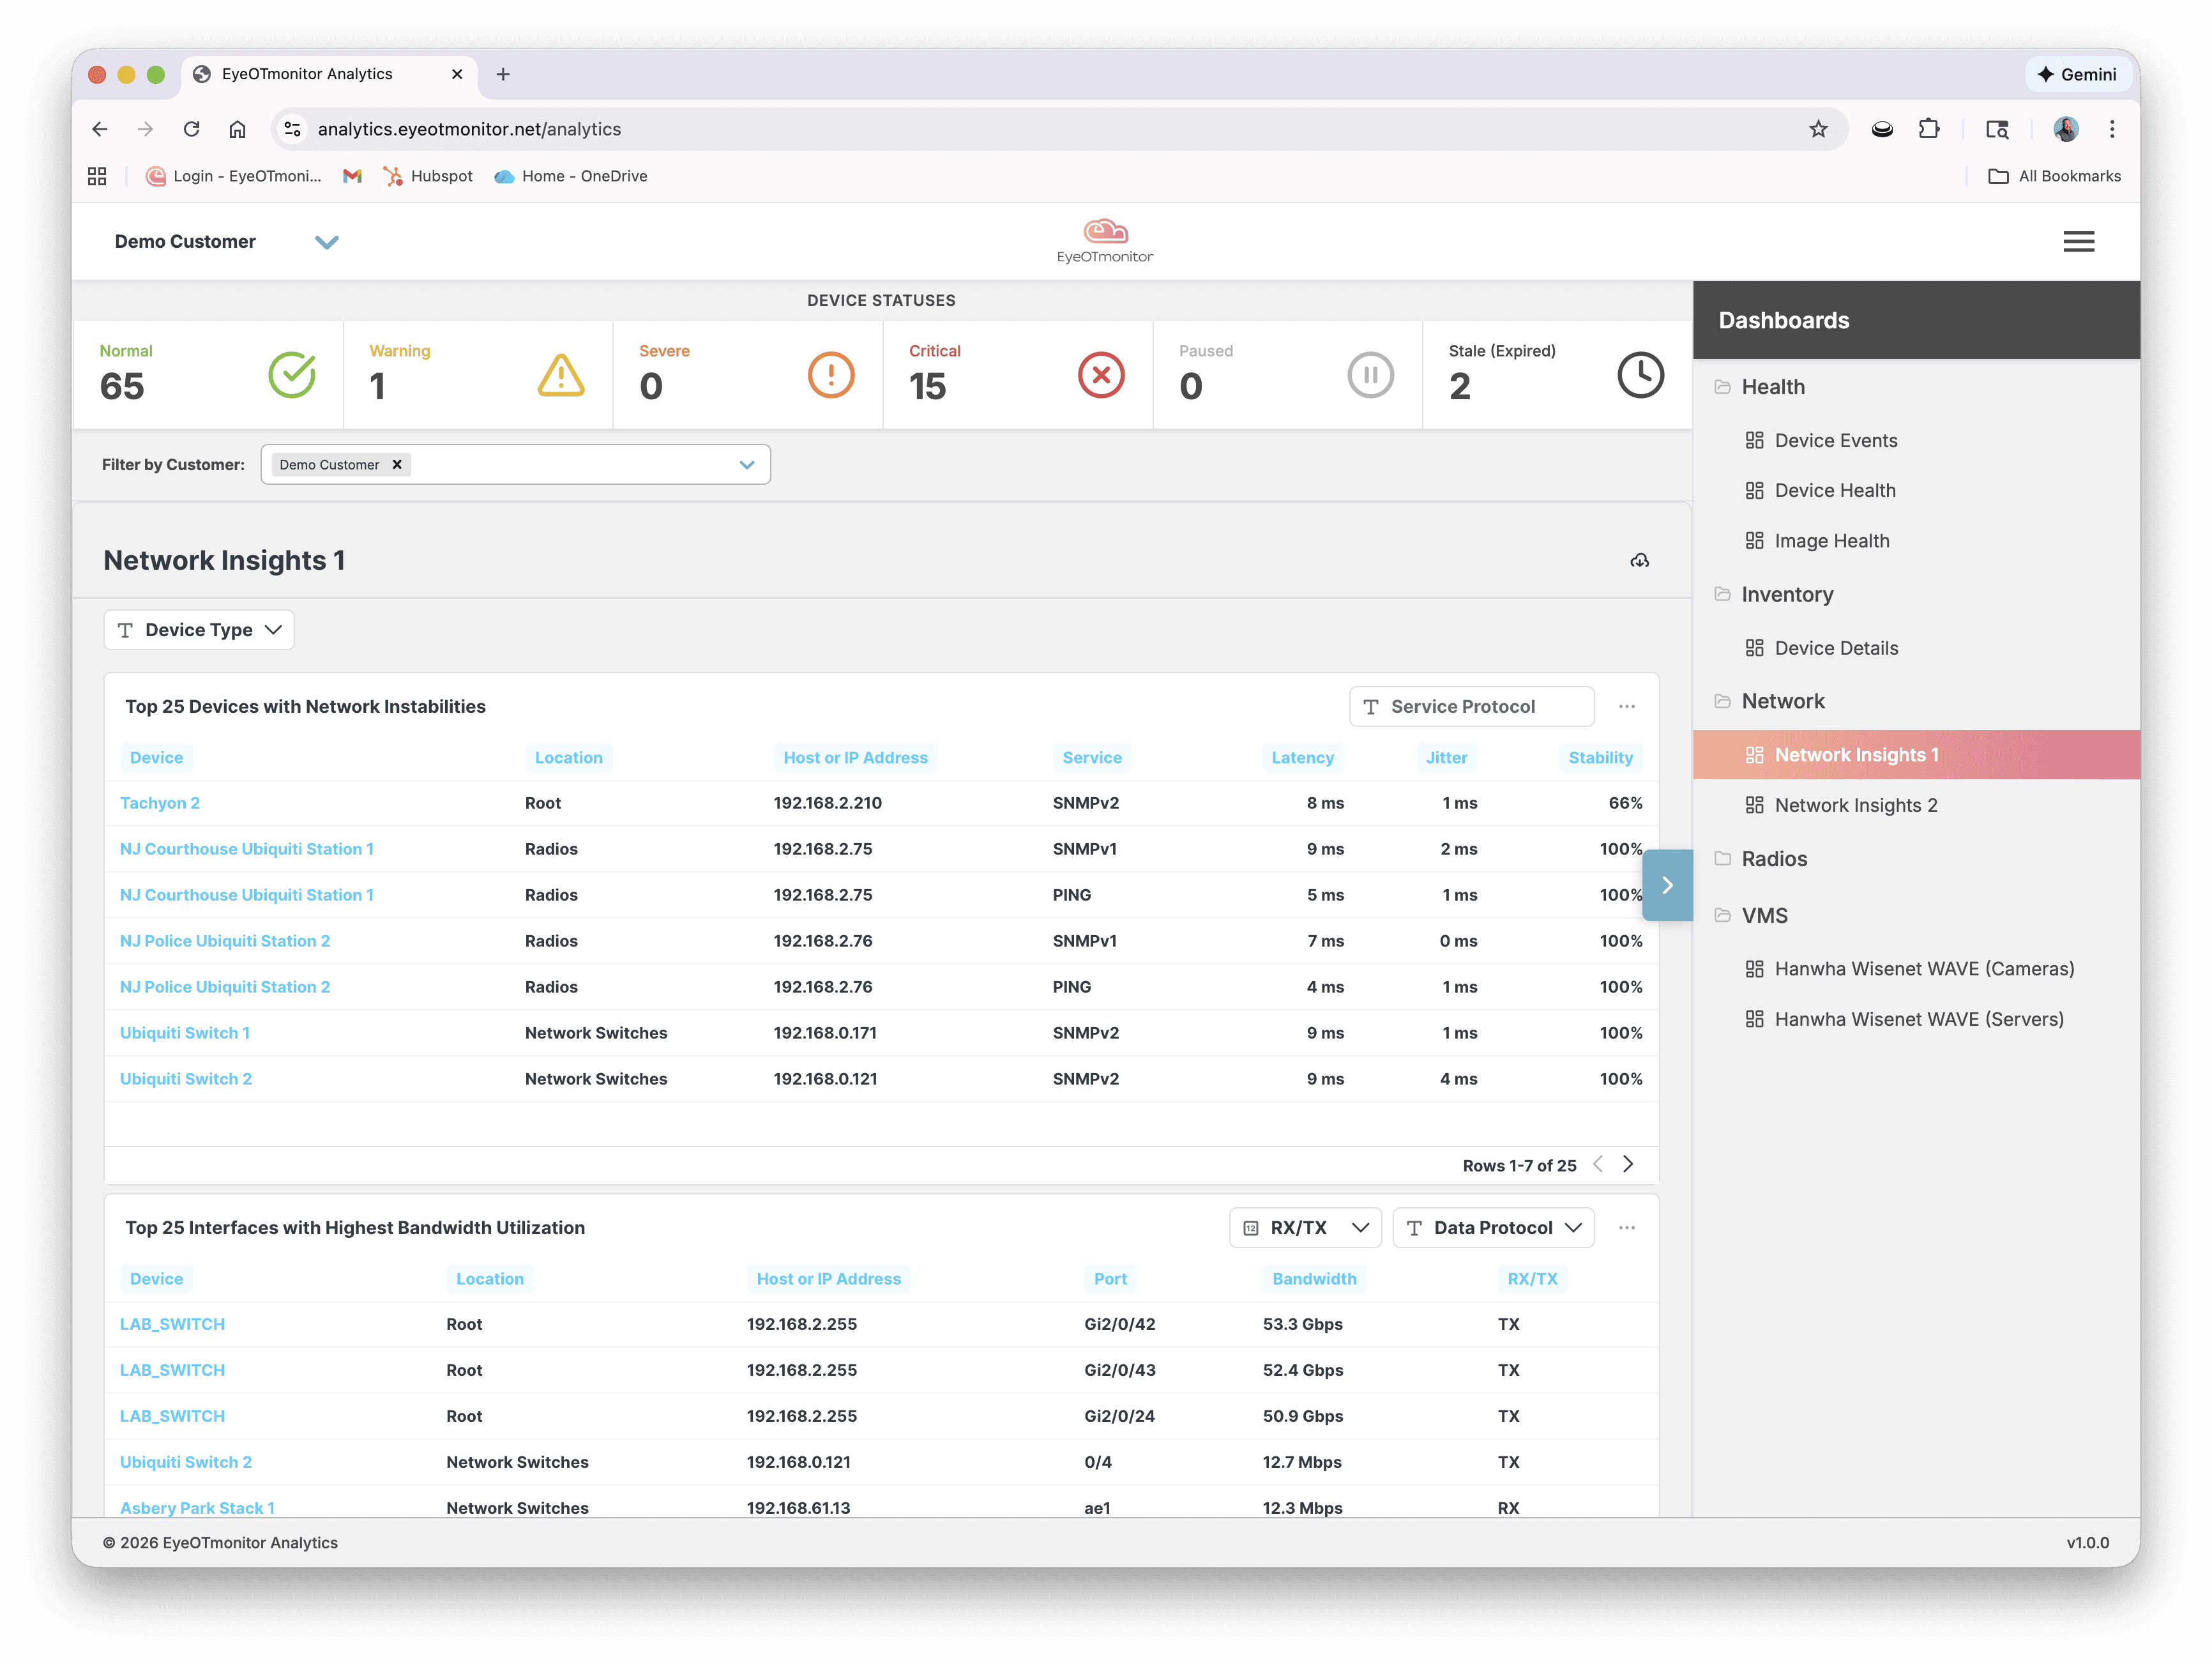
Network Insights That Explain Camera Problems
Many camera and VMS issues are rooted in network behavior. The Network Insights dashboards make those connections visible.
These dashboards highlight:
- Devices experiencing network instability
- Latency, jitter, and stability metrics tied to real devices
- Interfaces with the highest bandwidth utilization
- Network behavior that directly impacts video performance
Instead of guessing whether the network is involved, teams can see it clearly - and prove it.
Built for Custom KPIs and Real-World Roles
Every organization tracks performance differently.
With this release, EyeOTmonitor dashboards are easier to customize and deploy based on:
- Operational KPIs
- Specific customer or site needs
- Role-based views for NOC teams, integrators, consultants, or leadership
Dashboards can evolve as priorities change, without rebuilding reports from scratch.
Turning Monitoring Into Action
These new dashboards represent a shift from monitoring data to operational intelligence.
By bringing camera image health, VMS performance, inventory, and network insights into unified, customizable views, EyeOTmonitor helps teams:
- Spot issues earlier
- Prioritize work more effectively
- Reduce manual troubleshooting
- Keep video systems reliable when it matters most
This is just the beginning of what’s possible as we continue expanding analytics, reporting, and visualization across the platform.
When teams manage hundreds or thousands of cameras, recorders, and network devices, visibility can’t live in spreadsheets or one-off reports. It needs to be immediate, consistent, and easy to act on.
That’s why we’ve released new EyeOTmonitor dashboards - designed to make it faster to build, deploy, and customize KPI-driven views across camera health, VMS performance, inventory, and network stability.
These dashboards turn raw monitoring data into operational clarity, without forcing teams to stitch together multiple tools.
Camera Health Dashboards That Go Beyond “Online”
A camera being online doesn’t mean it’s usable.
The new Camera Image Health dashboards surface exactly what’s wrong with video streams — and how widespread those issues really are.
With these dashboards, teams can instantly see:
- Image issues broken down by type, such as no usable image, timestamp drift, obstruction, or blur
- Severity-based health status across all camera channels
- Aging issues and unresolved problems that have been impacting operations the longest
- Resolution trends showing what’s getting fixed and what’s being ignored
Instead of reacting to individual alerts, operators get a system-level view of image quality across sites, regions, or customers.
VMS-Specific Dashboards with Real Operational Context
Video systems don’t exist in isolation. That’s why we introduced VMS-specific dashboards, including dedicated views for platforms like Hanwha Wisenet WAVE.
These dashboards make it easy to track:
- Whether cameras are actively recording to the VMS
- Archive retention performance and gaps
- Camera and recorder status from the VMS perspective
- Recording stability and recent VMS flaps
By tying VMS data directly into EyeOTmonitor, teams can quickly answer questions like:
- Are cameras recording correctly?
- Are retention targets being met?
- Is an issue coming from the camera, the recorder, or the network path between them?
Inventory and Device Health at a Glance
Large environments fail quietly when device sprawl isn’t visible.
The new Inventory and Device Health dashboards give teams a single view of everything being monitored - cameras, switches, servers, radios, and more.
From these dashboards, operators can:
- See device health status across all monitored categories
- Break down inventory by vendor, model, and device type
- Identify critical or stale devices before they cause outages
- Quickly drill into uptime, agent status, and hardware details
This makes EyeOTmonitor not just a monitoring tool, but a living source of truth for system inventory.
Network Insights That Explain Camera Problems
Many camera and VMS issues are rooted in network behavior. The Network Insights dashboards make those connections visible.
These dashboards highlight:
- Devices experiencing network instability
- Latency, jitter, and stability metrics tied to real devices
- Interfaces with the highest bandwidth utilization
- Network behavior that directly impacts video performance
Instead of guessing whether the network is involved, teams can see it clearly - and prove it.
Built for Custom KPIs and Real-World Roles
Every organization tracks performance differently.
With this release, EyeOTmonitor dashboards are easier to customize and deploy based on:
- Operational KPIs
- Specific customer or site needs
- Role-based views for NOC teams, integrators, consultants, or leadership
Dashboards can evolve as priorities change, without rebuilding reports from scratch.
Turning Monitoring Into Action
These new dashboards represent a shift from monitoring data to operational intelligence.
By bringing camera image health, VMS performance, inventory, and network insights into unified, customizable views, EyeOTmonitor helps teams:
- Spot issues earlier
- Prioritize work more effectively
- Reduce manual troubleshooting
- Keep video systems reliable when it matters most
This is just the beginning of what’s possible as we continue expanding analytics, reporting, and visualization across the platform.
See EyeOTmonitor in Action
Get real-time visibility into your entire security system. Walk through the platform with our team and see how it fits your environment.

Image Health
Infrastructure Monitoring
Discovery & Mapping
Analytics
Integrations
Resources
Get Started
Pricing
© 2026 by EyeOTmonitor

See EyeOTmonitor in Action
Get real-time visibility into your entire security system. Walk through the platform with our team and see how it fits your environment.
Image Health
Infrastructure Monitoring
Discovery & Mapping
Analytics
Integrations
Resources
Get Started
Pricing
© 2026 by EyeOTmonitor
See EyeOTmonitor in Action
Get real-time visibility into your entire security system. Walk through the platform with our team and see how it fits your environment.
Image Health
Infrastructure Monitoring
Discovery & Mapping
Analytics
Solutions
By Role
Regional ISPs
Systems Integrators
MSPs
Integrations
Resources
Get Started
Pricing
© 2026 by EyeOTmonitor